| 3.2
|
Carbon dioxide concentrations, globally
averaged surface temperature, and sea level are projected to increase
under all IPCC emissions scenarios during the 21st century.
|
|
| 3.3 |
All SRES emissions scenarios result
in an increase in the atmospheric concentration of CO2 . For
the six illustrative SRES scenarios, the projected concentrations of CO2
-- the primary anthropogenic greenhouse gas -- in the year 2100 range
from 540 to 970 ppm, compared to about 280 ppm in the pre-industrial era
and about 368 ppm in the year 2000 (see Figure
3-1f). These projections include the land and ocean climate feedbacks.
The different socio-economic assumptions (demographic, social, economic,
and technological) result in different levels of future greenhouse gases
and aerosols. Further uncertainties, especially regarding the persistence
of the present removal processes (carbon sinks) and the magnitude of the
climate feedback on the terrestrial biosphere, cause a variation of about
-10 to +30% in the year 2100 concentration, around each scenario. The
total range is 490 to 1,260 ppm (75 to 350% above the year 1750 (pre-industrial)
concentration).
|
 WGI TAR Section 3.7.3.3
|
| 3.4 |
Model calculations of the concentrations
of the primary non-CO2 greenhouse gases by year 2100 vary considerably
across the six illustrative SRES scenarios. For most cases, A1B,
A1T, and B1 have the smallest increases, and A1FI and A2 the largest (see
Figures 3-1g and 3-1h).
|
WGI TAR Section 4.4.5 &
WGI TAR Box 9.1
|
| 3.5 |
The SRES scenarios include the possibility
of either increases or decreases in anthropogenic aerosols, depending on
the extent of fossil-fuel use and policies to abate polluting emissions.
As seen in Figure 3-1i, sulfate aerosol
concentrations are projected to fall below present levels by 2100 in all
six illustrative SRES
scenarios. This would result in warming relative to present day. In addition,
natural aerosols (e.g., sea salt, dust, and emissions leading to sulfate
and carbon aerosols) are projected to increase as a result of changes in
climate.
|
WGI TAR Section 5.5 &
SRES
Section 3.6.4
|
| 3.6 |
The globally averaged surface temperature
is projected to increase by 1.4 to 5.8°C over the period 1990 to 2100
(see Figure 3-1k). This is about two
to ten times larger than the central value of observed warming over the
20th century and the projected rate of warming is very likely to be without
precedent during at least the last 10,000 years, based on paleoclimate data
(see Figure 9-1).
For the periods 1990 to 2025 and 1990 to 2050, the projected increases
are 0.4 to 1.1°C and 0.8 to 2.6°C, respectively. These results are
for the full range of 35 SRES
scenarios, based on a number of climate models.4
Temperature increases are projected to be greater than those in the SAR,
which were about 1.0 to 3.5°C based on six IS92 scenarios. The higher
projected temperatures and the wider range are due primarily to lower projected
SO2 emissions in the SRES
scenarios relative to the IS92 scenarios, because of structural changes
in the energy system as well as concerns about local and regional air pollution.
|
WGI TAR Section 9.3.3
|
| 3.7 |
By 2100, the range in the surface temperature
response across different climate models for the same emissions scenario
is comparable to the range across different SRES
emissions scenarios for a single climate model. Figure
3-1 shows that the SRES
scenarios with the highest emissions result in the largest projected temperature
increases. Further uncertainties arise due to uncertainties in the radiative
forcing. The largest forcing uncertainty is that due to the sulfate aerosols.
|
WGI TAR Section 9.3.3
|
| |
 |
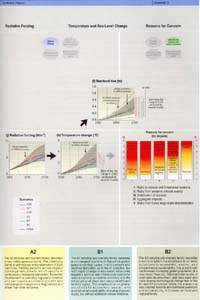 |
| Figure
3-1 (two parts): The different socio-economic assumptions underlying
the SRES
scenarios result in different levels of future emissions of greenhouse
gases and aerosols. These emissions in turn change the concentration
of these gases and aerosols in the atmosphere, leading to changed
radiative forcing of the climate system. Radiative forcing due to
the SRES
scenarios results in projected increases in temperature and sea level,
which in turn will cause impacts. The SRES
scenarios do not include additional climate initiatives and no probabilities
of occurrence are assigned. Because the SRES
scenarios had only been available for a very short time prior to production
of the TAR, the impacts assessments here use climate model results
which tend to be based on equilibrium climate change scenarios (e.g.,
2xCO2 ), a relatively small number of experiments using
a 1% per year CO2 increase transient scenario, or the scenarios
used in the Second Assessment Report (i.e., the IS92 series). Impacts
in turn can affect socio-economic development paths through, for example,
adaptation and mitigation. The highlighted boxes along the top of
the figure illustrate how the various aspects relate to the integrated
assessment framework for considering climate change (see Figure
1-1). |
|
WGI TAR Figures 3.12,
4.14, 5.13,
9.13, 9.14,
& 11.12, WGII
TAR Figure 19-7, & SRES
Figures SPM-2, SPM-5,
SPM-6,
& TS-10
|
|
|
