3.7.3.3 SRES scenarios and their implications for future CO2 concentration
The Special Report on Emissions Scenarios (SRES) (IPCC, 2000b) produced a series
of scenarios, of which six are used here, representing outcomes of distinct
narratives of economic development and demographic and technological change.
In ISAM model runs with these scenarios, past fossil emissions (see Section
3.4.1), CO2 concentrations (Enting et al., 1994; Keeling and
Whorf, 2000) and mean global temperatures (Jones et al., 2000) were specified
up to and including 1999; scenario-based analyses started in 2000. In the Bern-CC
model runs, observed CO2 (Etheridge, et al., 1996, Keeling and Whorf,
2000) and past fossil emissions (Marland et al., 1999) were prescribed, and
historical temperature changes were modelled, based on radiative forcing from
greenhouse gases and aerosols; again, scenario-based analyses started in 2000.
Past emissions from changing land use were calculated in order to balance the
carbon budget.
The six scenarios lead to substantial differences in projected CO2
concentration trajectories (Figure 3.12). Significant
uncertainties are introduced by the range of model parametrizations considered,
so that the trajectories calculated for “adjacent” scenarios overlap,
especially during the first half-century. The reference cases of the six scenarios
account for a range of 2100 CO2 concentrations from 541 to 963 ppm
in the Bern-CC model and 549 to 970 ppm in the ISAM model. The uncertainties
around the 2100 values due to model parametrizations are -12 to +10 % (ISAM)
and -14 to +31 % (Bern-CC).
These uncertainties reflect incomplete understanding of climate sensitivity
and the carbon cycle. They substantially limit our current ability to make quantitative
predictions about the future consequences of a given emissions trajectory. Nevertheless,
the results show that higher emissions are always expected to lead to higher
projected atmospheric concentrations. They also show that the range of emissions
scenarios currently accepted as plausible leads to a range of CO2
concentrations that exceeds the likely upper bound of uncertainties due to differences
among model parameterizations and assumptions.
|
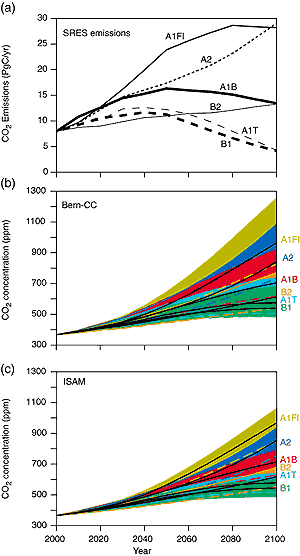
Figure 3.12: Projected CO2 concentrations resulting
from six SRES scenarios. The SRES scenarios represent the outcome of different
assumptions about the future course of economic development, demography
and technological change (see Appendix II). Panel
(a) shows CO2 emissions for the selected scenarios and panels
(b) and (c) show resulting CO2 concentrations as projected
by two fast carbon cycle models, Bern-CC and ISAM (see Box
3.7 and Figure 3.11). The ranges represent
effects of different model parametrizations and assumptions as indicated
in the text and in the caption to Figure 3.11.
For each model, and each scenario the reference case is shown by a black
line, the upper bound (high-CO2 parametrization) is indicated
by the top of the coloured area, and the lower bound (low-CO2
parametrization) by the bottom of the coloured area or (where hidden)
by a dashed coloured line.
|
|