| |
| Table 6-1:
Projected CO2 concentrations for the SRES emissions scenarios
and deduced emissions for the WRE profiles leading to stabilization
of atmospheric CO2.a |
| |
CO2
Emissions
(Gt C yr-1 ) |
Accumulated CO2 Emissions |
Year in which Emissions |
Atmospheric
Concentration (ppm) |
Year of
Concentration
Stabilization |
| |
2050 |
2100 |
2001 to 2100 (Gt C) |
Peak |
Fall below
1990 Levelsb |
2050 |
2100 |
| SRES Emissions Scenarios |
|
A1B
A1T
A1FI
A2
B1
B2 |
16.4
12.3
23.9
17.4
11.3
11.0 |
13.5
4.3
28.2
29.1
4.2
13.3 |
1,415
985
2,105
1,780
900
1,080 |
|
|
490-600
465-560
520-640
490-600
455-545
445-530 |
615-920
505-735
825-1,250
735-1,080
485-680
545-770 |
|
| WRE Stabilization Profiles |
|
450
550
650
750
1,000 |
3.0-6.9
6.4-12.6
8.1-15.3
8.9-16.4
9.5-17.2 |
1.0-3.7
2.7-7.7
4.8-11.7
6.6-14.6
9.1-18.4 |
365-735
590-1,135
735-1,370
820-1,500
905-1,620 |
2005-2015
2020-2030
2030-2045
2040-2060
2065-2090 |
<2000-2045
2030-2100
2055-2145
2080-2180
2135-2270 |
445
485
500
505
510 |
450
540
605
640
675 |
2090
2150
2200
2250
2375 |
a. blue text
= prescribed and black text = model results; both fossil-fuel
and land-use change emissions are considered. Ranges from two simple
carbon cycle models: ISAM model range is based on complex model
results, while BERN-CC model range is based on uncertainties in
system responses and feedbacks. The SRES results can be found in
Appendix II.1.1 of the WGI TAR. The exact timing of the WRE emissions
depends on the pathway to stabilization.
b. 1990 emissions are taken to be 7.8 Gt C; this
value is uncertain primarily due to the uncertainty in the size
of the land-use change emissions, assumed here to be 1.7 Gt C, the
annual average value through the 1980s.
|
|
|
| |
|
|
| 6.6 |
Emission reductions that would eventually
stabilize the atmospheric concentration of CO2 at a level below
1,000 ppm, based on profiles shown in Figure
6-1, and assuming that emissions of gases other than CO2
follow the SRES A1B projection until the year 2100 and are constant thereafter,
are estimated to limit global mean temperature increase to 3.5°C or
less through the year 2100. Global average surface temperature is
estimated to increase 1.2 to 3.5°C by the year 2100for profiles that
would limit CO2 emissions so as to eventually stabilize the concentration
of CO2 at a level from 450 to 1,000 ppm. Thus, although all of
the CO2 concentration stabilization profiles analyzed would prevent,
during the 21st century, much of the upperend of the SRES projections of
warming (1.4 to 5.8°C by the year 2100), it should be noted that for
most of the profiles the concentration of CO2 would continue
to rise beyond the year 2100. Owing to the large inertia of the ocean (see
Question 5), temperatures are projected
to continue to rise even after stabilization of CO2 and other
greenhouse gas concentrations, though at a rate that is slower than is projected
for the period prior to stabilization and that diminishes with time. The
equilibrium temperature rise would take many centuries to reach, and ranges
from 1.5 to 3.9°C above the year 1990 levels for stabilization at 450
ppm and 3.5 to 8.7°C above the year 1990 levels for stabilization at
1,000 ppm.8
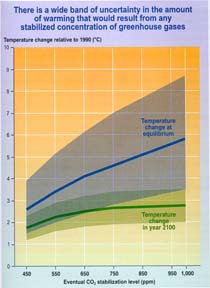
Furthermore, for a specific temperature stabilization target, there is a
very wide range of uncertainty associated with the required stabilization
level of greenhouse gas concentration (see Figure
6-2). The level at which CO2 concentration is required to
be stabilized for a given temperature target also depends on the levels
of the non-CO2 gases. Results from the only comprehensive climate
model that has been used to analyze the regional effects of stabilizing
CO2 concentrations project that regionally averaged temperature
changes would be similar in geographic pattern but less in magnitude than
those projected for a baseline scenario with a 1% per year increase in CO2
emissions from the year 1990.9
|
 WGI TAR Section 9.3.3
& WGI TAR Table 9.3
WGI TAR Section 9.3.3
& WGI TAR Table 9.3 |
| 6.7 |
Different time paths of emissions that
lead to a common level for stabilization of the atmospheric concentration
of greenhouse gases yield different time paths of temperature change.
For CO2 stabilization levels of 450, 550, 650, and 750 ppm, two
sets of emission time paths have been analyzed in previous IPCC reports
and are referred to as the S and WRE profiles.10
The WRE profiles allow higher emissions in early decades than do the S profiles,
but then must require lower emissions in later decades to achieve a specified
stabilization level. This deferment of emission reductions in the WRE profiles
is estimated to reduce mitigation costs (see Question
7) but would result in a more rapid rate of warming initially. The difference
in temperature projections for the two sets of pathways is 0.2°C or
less in the year 2050, when the difference is most pronounced. Beyond the
year 2100, the temperature changes of the WRE and S profiles converge. The
temperature projections for the S and WRE profiles are compared in Figure
6-1c.
|
WGI
TAR Section 9.3.3.1 |
| 6.8 |
Sea level and ice sheets would continue
to respond to warming for many centuries after greenhouse gas concentrations
have been stabilized (see Question 5). The
projected range of sea-level rise due to thermal expansion at equilibrium
is 0.5 to 2 m for an increase in CO2 concentration from the pre-industrial
level of 280 to 560 ppm and 1 to 4 m for an increase in CO2 concentration
from 280 to 1,120 ppm. The observed rise over the 20th century was 0.1 to
0.2 m. The projected rise would be larger if the effect of increases in
other greenhouse gas concentrations were to be taken into account. There
are other contributions to sea-level rise over time scales of centuries
to millennia (see Question 5). Models assessed in
the TAR project sea-level rise of several meters from polar ice sheets (see
Question 4) and land ice even for stabilization levels
of 550 ppm CO2 -equivalent.
|
WGI
TAR SPM & WGI TAR Section 11.5.4 |
| |
Figure 6-2: Temperature changes relative to 1990in
(a) year 2100 and (b) at equilibrium are estimated using a simple climate
model for the WRE profiles as in Figure 6-1.
The lowest and highest estimates for each stabilization level assume
a climate sensitivity of 1.7 and 4.2°C, respectively. The center line
is an average of the low and high estimates. |
WGI TAR Section 9.3.3 |
|
|