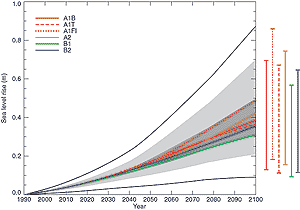
F.9 Projections of Future Changes in Sea Level

Figure 24: Global average sea level rise 1990 to 2100 for the SRES
scenarios. Thermal expansion and land ice changes were calculated using
a simple climate model calibrated separately for each of seven AOGCMs, and
contributions from changes in permafrost, the effect of sediment deposition
and the long-term adjustment of the ice sheets to past climate change were
added. Each of the six lines appearing in the key is the average of AOGCMs
for one of the six illustrative scenarios. The region in dark shading shows
the range of the average of AOGCMs for all thirty five SRES scenarios. The
region in light shading shows the range of all AOGCMs for all thirty five
scenarios. The region delimited by the outermost lines shows the range of
all AOGCMs and scenarios including uncertainty in land-ice changes, permafrost
changes and sediment deposition. Note that this range does not allow for
uncertainty relating to ice-dynamic changes in the West Antarctic ice sheet.
[Based on Figure
11.12] |
Projections of global average sea level rise from 1990 to 2100, using a range
of AOGCMs following the IS92a scenario (including the direct effect of sulphate
aerosol emissions), lie in the range 0.11 to 0.77 m. This range reflects the systematic
uncertainty of modelling. The main contributions to this sea level rise are:
- a thermal expansion of 0.11 to 0.43 m, accelerating through the 21st century;
- a glacier contribution of 0.01 to 0.23 m;
- a Greenland contribution of -0.02 to 0.09 m; and
- an Antarctic contribution of -0.17 to +0.02 m.
Also included in the computation of the total change are smaller contributions
from thawing of permafrost, deposition of sediment, and the ongoing contributions
from ice sheets as a result of climate change since the Last Glacial Maximum.
To establish the range of sea level rise resulting from the choice of different
SRES scenarios, results for thermal expansion and land-ice change from simple
models tuned to several AOGCMs are used (as in Section
F.3 for temperature).
For the full set of SRES scenarios, a sea level rise of 0.09 to 0.88 m is
projected for 1990 to 2100 (see Figure 24), primarily
from thermal expansion and loss of mass from glaciers and ice caps. The
central value is 0.48 m, which corresponds to an average rate of about two to
four times the rate over the 20th century. The range of sea level rise presented
in the SAR was 0.13 to 0.94 m based on the IS92 scenarios. Despite higher temperature
change projections in this assessment, the sea level projections are slightly
lower, primarily due to the use of improved models which give a smaller contribution
from glaciers and ice sheets. If terrestrial storage continues at its current
rates, the projections could be changed by –0.21 to 0.11 m. For an average
of the AOGCMs, the SRES scenarios give results that differ by 0.02 m or less
for the first half of the 21st century. By 2100, they vary over a range amounting
to about 50% of the central value. Beyond the 21st century, sea level rise depends
strongly on the emissions scenario.
Models agree on the qualitative conclusion that the range of regional variation
in sea level change is substantial compared to global average sea level rise.
However, confidence in the regional distribution of sea level change from AOGCMs
is low because there is little similarity between models, although nearly all
models project greater than average rise in the Arctic Ocean and less than average
rise in the Southern Ocean. Further, land movements, both isostatic and tectonic,
will continue through the 21st century at rates that are unaffected by climate
change. It can be expected that by 2100, many regions currently experiencing
relative sea level fall will instead have a rising relative sea level. Lastly,
extreme high water levels will occur with increasing frequency as a result of
mean sea level rise. Their frequency may be further increased if storms become
more frequent or severe as a result of climate change.
|

