F.3 Projections of Future Changes in Temperature
AOGCM results

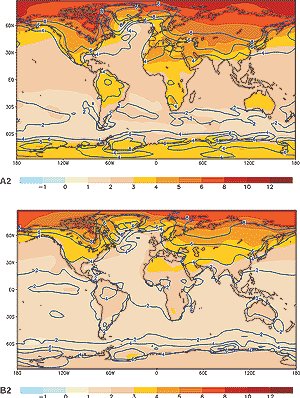
Figure 20: The annual mean change of the temperature (colour shading)
and its range (isolines) (Unit: °C) for the SRES scenario A2
(upper panel) and the SRES scenario B2 (lower
panel). Both SRES scenarios show the period 2071 to 2100 relative to the
period 1961 to 1990 and were performed by OAGCMs. [Based on Figures
9.10d and 9.10e]
|

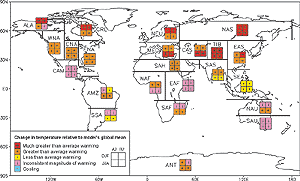
Figure 21: Analysis of inter-model consistency in regional relative
warming (warming relative to each model's global average warming). Regions
are classified as showing either agreement on warming in excess of 40% above
the global average ('Much greater than average warming'), agreement
on warming greater than the global average ('Greater than average warming'),
agreement on warming less than the global average ('Less than average
warming'), or disagreement amongst models on the magnitude of regional relative
warming ('Inconsistent magnitude of warming'). There is also a category
for agreement on cooling (which never occurs). A consistent result from
at least seven of the nine models is deemed necessary for agreement. The
global annual average warming of the models used span 1.2 to 4.5°C for
A2 and 0.9 to 3.4°C for B2,
and therefore a regional 40% amplification represents warming ranges of
1.7 to 6.3°C for A2 and 1.3 to 4.7°C
for B2. [Based on Chapter
10, Box
1 , Figure 1] |
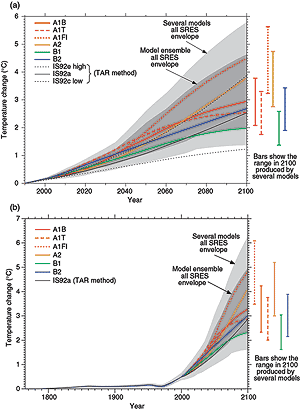
 Figure 22: Simple model results: (a) global mean temperature projections
for the six illustrative SRES scenarios using a simple climate model tuned
to a number of complex models with a range of climate sensitivities. Also
for comparison, following the same method, results are shown for IS92a.
The darker shading represents the envelope of the full set of thirty-five
SRES scenarios using the average of the model results (mean climate sensitivity
is 2.8°C). The lighter shading is the envelope based on all seven model
projections (with climate sensitivity in the range 1.7 to 4.2°C). The
bars show, for each of the six illustrative SRES scenarios, the range of
simple model results in 2100 for the seven AOGCM model tunings.
(b) Same as (a) but results using estimated historical anthropogenic
forcing are also used. [Based on Figures
9.14 and 9.13b]
|
Climate sensitivity is likely to be in the range of 1.5 to 4.5°C. This
estimate is unchanged from the first IPCC Assessment Report in 1990 and the SAR.
The climate sensitivity is the equilibrium response of global surface temperature
to a doubling of equivalent CO2 concentration. The range of estimates
arises from uncertainties in the climate models and their internal feedbacks,
particularly those related to clouds and related processes. Used for the first
time in this IPCC report is the Transient Climate Response (TCR). The TCR is defined
as the globally averaged surface air temperature change, at the time of doubling
of CO2, in a 1%/yr CO2-increase experiment. This rate of
CO2 increase is assumed to represent the radiative forcing from all
greenhouse gases. The TCR combines elements of model sensitivity and factors that
affect response (e.g., ocean heat uptake). The range of the TCR for current AOGCMs
is 1.1 to 3.1°C.
Including the direct effect of sulphate aerosols reduces global mean mid-21st
century warming. The surface temperature response pattern for a given model,
with and without sulphate aerosols, is more similar than the pattern between
two models using the same forcing.
Models project changes in several broad-scale climate variables. As
the radiative forcing of the climate system changes, the land warms faster and
more than the ocean, and there is greater relative warming at high latitudes.
Models project a smaller surface air temperature increase in the North Atlantic
and circumpolar southern ocean regions relative to the global mean. There is
projected to be a decrease in diurnal temperature range in many areas, with
night-time lows increasing more than daytime highs. A number of models show
a general decrease of daily variability of surface air temperature in winter
and increased daily variability in summer in the Northern Hemisphere land areas.
As the climate warms, the Northern Hemisphere snow cover and sea-ice extent
are projected to decrease. Many of these changes are consistent with recent
observational trends, as noted in Section B.
Multi-model ensembles of AOGCM simulations for a range of scenarios are
being used to quantify the mean climate change and uncertainty based on the
range of model results. For the end of the 21st century (2071 to 2100),
the mean change in global average surface air temperature, relative to the period
1961 to 1990, is 3.0°C (with a range of 1.3 to 4.5°C) for the A2
draft marker scenario and 2.2°C (with a range of 0.9 to 3.4°C) for the
B2 draft marker scenario. The B2
scenario produces a smaller warming that is consistent with its lower rate of
increased CO2 concentration.
On time-scales of a few decades, the current observed rate of warming can
be used to constrain the projected response to a given emissions scenario despite
uncertainty in climate sensitivity. Analysis of simple models and intercomparisons
of AOGCM responses to idealised forcing scenarios suggest that, for most scenarios
over the coming decades, errors in large-scale temperature projections are likely
to increase in proportion to the magnitude of the overall response. The estimated
size of and uncertainty in current observed warming rates attributable to human
influence thus provides a relatively model-independent estimate of uncertainty
in multi-decade projections under most scenarios. To be consistent with recent
observations, anthropogenic warming is likely to lie in the range 0.1 to 0.2°C/decade
over the next few decades under the IS92a scenario. This is similar to the range
of responses to this scenario based on the seven versions of the simple model
used in Figure 22.
Most of the features of the geographical response in the SRES scenario experiments
are similar for different scenarios (see Figure 20)
and are similar to those for idealised 1% CO2-increase integrations.
The biggest difference between the 1% CO2-increase experiments,
which have no sulphate aerosol, and the SRES experiments is the regional moderating
of the warming over industrialised areas, in the SRES experiments, where the
negative forcing from sulphate aerosols is greatest. This regional effect was
noted in the SAR for only two models, but this has now been shown to be a consistent
response across the greater number of more recent models.
It is very likely that nearly all land areas will warm more rapidly than
the global average, particularly those at northern high latitudes in the cold
season. Results (see Figure 21) from recent
AOGCM simulations forced with SRES A2 and B2
emissions scenarios indicate that in winter the warming for all high-latitude
northern regions exceeds the global mean warming in each model by more than
40% (1.3 to 6.3°C for the range of models and scenarios considered). In
summer, warming is in excess of 40% above the global mean change in central
and northern Asia. Only in south Asia and southern South America in June/July/
August, and Southeast Asia for both seasons, do the models consistently show
warming less than the global average.
Simple climate model results
Due to computational expense, AOGCMs can only be run for a limited number of
scenarios. A simple model can be calibrated to represent globally averaged
AOGCM responses and run for a much larger number of scenarios.
The globally averaged surface temperature is projected to increase by 1.4
to 5.8°C (Figure 22(a)) over the period 1990
to 2100. These results are for the full range of 35 SRES scenarios, based
on a number of climate models. 6,
7
Temperature increases are projected to be greater than those in the SAR, which
were about 1.0 to 3.5°C based on six IS92 scenarios. The higher projected
temperatures and the wider range are due primarily to the lower projected SO2
emissions in the SRES scenarios relative to the IS92 scenarios. The projected
rate of warming is much larger than the observed changes during the 20th century
and is very likely to be without precedent during at least the last 10,000 years,
based on palaeoclimate data.
The relative ranking of the SRES scenarios in terms of global mean temperature
changes with time. In particular, for scenarios with higher fossil fuel
use (hence, higher carbon dioxide emissions, e.g., A2),
the SO2 emissions are also higher. In the near term (to around 2050),
the cooling effect of higher sulphur dioxide emissions significantly reduces
the warming caused by increased emissions of greenhouse gases in scenarios such
as A2. The opposite effect is seen for scenarios
B1 and B2, which
have lower fossil fuel emissions as well as lower SO2 emissions,
and lead to a larger near-term warming. In the longer term, however, the level
of emissions of long-lived greenhouse gases such as CO2 and N2O
become the dominant determinants of the resulting climate changes.
By 2100, differences in emissions in the SRES scenarios and different climate
model responses contribute similar uncertainty to the range of global temperature
change. Further uncertainties arise due to uncertainties in the radiative
forcing. The largest forcing uncertainty is that due to the sulphate aerosols.
|

