|
|
 |
 |
 |
 |
|
REPORTS - ASSESSMENT REPORTS |
|
 |
|
 |
|
|
|
|
 |
|
Climate Change 2001: Synthesis Report |
|
|
|
 |
| Question 3
What is known about the regional and global climatic,
environmental, and socio-economic consequences in the next 25, 50, and
100 years associated with a range of greenhouse gas emissions arising
from scenarios used in the TAR (projections which involve no climate policy
intervention)?
To the extent possible evaluate the:
- Projected changes in atmospheric concentrations,
climate, and sea level
- Impacts and economic costs and benefits of changes
in climate and atmospheric composition on human health, diversity and
productivity of ecological systems, and socio-economic sectors (particularly
agriculture and water)
- The range of options for adaptation, including the
costs, benefits, and challenges
- Development, sustainability, and equity issues associated
with impacts and adaptation at a regional and global level.
|
 |
|
| |
|
| Carbon dioxide concentrations, globally averaged
surface temperature, and sea level are projected to increase under all
IPCC emissions scenarios during the 21st century.2 |
 Q3.2
Q3.2 |
| |
|
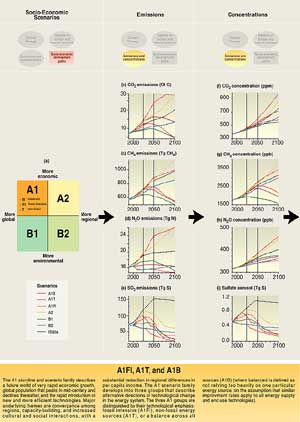
| For the six illustrative SRES emissions scenarios,
the projected concentration of CO2 in the year 2100 ranges
from 540 to 970 ppm, compared to about 280 ppm in the pre-industrial era
and about 368 ppm in the year 2000. The different socio-economic
assumptions (demographic, social, economic, and technological) result
in the different levels of future greenhouse gases and aerosols. Further
uncertainties, especially regarding the persistence of the present removal
processes (carbon sinks) and the magnitude of the climate feedback on
the terrestrial biosphere, cause a variation of about -10 to +30% in the
year 2100 concentration, around each scenario. Therefore, the total range
is 490 to 1,260 ppm (75 to 350% above the year 1750 (pre-industrial) concentration).
Concentrations of the primary non-CO2 greenhouse gases by year
2100 are projected to vary considerably across the six illustrative SRES
scenarios (see Figure SPM-3). |
Q3.3-5 |
| |
|
| Projections using the SRES emissions scenarios in
a range of climate models result in an increase in globally averaged surface
temperature of 1.4 to 5.8°C over the period 1990 to 2100. This is about
two to ten times larger than the central value of observed warming over
the 20th century and the projected rate of warming is very likely to be
without precedent during at least the last 10,000 years, based on paleoclimate
data. Temperature increases are
projected to be greater than those in the Second Assessment Report (SAR),
which were about 1.0 to 3.5°C based on six IS92 scenarios. The higher
projected temperatures and the wider range are due primarily to lower projected
sulfur dioxide (SO2 ) emissions in the SRES scenarios relative
to the IS92 scenarios. For the periods 1990 to 2025 and 1990 to 2050, the
projected increases are 0.4 to 1.1°C and 0.8 to 2.6°C, respectively.
By the year 2100, the range in the surface temperature response across different
climate models for the same emissions scenario is comparable to the range
across different SRES emissions scenarios for a single climate model. Figure
SPM-3 shows that the SRES scenarios with the highest emissions result
in the largest projected temperature increases. Nearly all land areas will
very likely warm more than these global averages, particularly those at
northern high latitudes in winter. |
Q3.6-7
& Q3.11 |
| |
|
| Globally averaged annual precipitation is projected
to increase during the 21st century, though at regional scales both increases
and decreases are projected of typically 5 to 20%. It is likely that
precipitation will increase over high-latitude regions in both summer and
winter. Increases are also projected over northern mid-latitudes, tropical
Africa, and Antarctica in winter, and in southern and eastern Asia in summer.
Australia, Central America, and southern Africa show consistent decreases
in winter rainfall. Larger year-to-year variations in precipitation are
very likely over most areas where an increase in mean precipitation is projected. |
Q3.8 &
Q3.12 |
| |
|
| Glaciers are projected to continue their widespread
retreat during the 21st century. Northern
Hemisphere snow cover, permafrost, and sea-ice extent are projected to decrease
further. The Antarctic ice sheet is likely to gain mass, while the Greenland
ice sheet is likely to lose mass (see Question 4). |
Q3.14 |
| |
|
| Global mean sea level is projected to rise by 0.09
to 0.88 m between the years 1990 and 2100, for the full range of SRES scenarios,
but with significant regional variations. This rise is due primarily
to thermal expansion of the oceans and melting of glaciers and ice caps.
For the periods 1990 to 2025 and 1990 to 2050, the projected rises are 0.03
to 0.14 m and 0.05 to 0.32 m, respectively. |
Q3.9 &
Q3.13 |
| |
|
| Projected climate change will have beneficial and adverse
effects on both environmental and socio-economic systems, but the larger
the changes and rate of change in climate, the more the adverse effects
predominate. |
Q3.15 |
| |
|
| The severity of the adverse impacts will be larger
for greater cumulative emissions of greenhouse gases and associated changes
in climate (medium confidence). While beneficial effects
can be identified for some regions and sectors for small amounts of climate
change, these are expected to diminish as the magnitude of climate change
increases. In contrast many identified adverse effects are expected to increase
in both extent and severity with the degree of climate change. When considered
by region, adverse effects are projected to predominate for much of the
world, particularly in the tropics and subtropics. |
Q3.16 |
| |
|
| Overall, climate change is projected to increase threats
to human health, particularly in lower income populations, predominantly
within tropical/subtropical countries. Climate change can affect
human health directly (e.g., reduced cold stress in temperate countries
but increased heat stress, loss of life in floods and storms) and indirectly
through changes in the ranges of disease vectors (e.g., mosquitoes),3
water-borne pathogens, water quality, air quality, and food availability
and quality (medium to high confidence). The actual health impacts
will be strongly influenced by local environmental conditions and socio-economic
circumstances, and by the range of social, institutional, technological,
and behavioral adaptations taken to reduce the full range of threats to
health. |
Q3.17 |
| |
|
| Ecological productivity and biodiversity
will be altered by climate change and sea-level rise, with an increased
risk of extinction of some vulnerable species (high to medium confidence).
Significant disruptions of ecosystems from disturbances such as fire,
drought, pest infestation, invasion of species, storms, and coral bleaching
events are expected to increase. The stresses caused by climate change,
when added to other stresses on ecological systems, threaten substantial
damage to or complete loss of some unique systems and extinction of some
endangered species. The effect of increasing CO2 concentrations
will increase net primary productivity of plants, but climate changes,
and the changes in disturbance regimes associated with them, may lead
to either increased or decreased net ecosystem productivity (medium
confidence). Some global models project that the net uptake of carbon
by terrestrial ecosystems will increase during the first half of the 21st
century but then level off or decline.
 |
 |
| Figure
SPM-3: The different socio-economic assumptions
underlying the SRES scenarios result in different levels of future
emissions of greenhouse gases and aerosols.These
emissions in turn change the concentration of these gases and aerosols
in the atmosphere, leading to changed radiative forcing of the climate
system. Radiative forcing due to the SRES scenarios results in projected
increases in temperature and sea level, which in turn will cause impacts.
The SRES scenarios do not include additional climate initiatives and
no probabilities of occurrence are assigned. Because the SRES scenarios
had only been available for a very short time prior to production
of the TAR, the impacts assessments here use climate model results
that tend to be based on equilibrium climate change scenarios (e.g.,
2xCO2 ), a relatively small number of experiments using
a 1% per year CO2 increase transient scenario, or the scenarios
used in the SAR (i.e., the IS92 series). Impacts in turn can affect
socio-economic development paths through, for example, adaptation
and mitigation. The highlighted boxes along the top of the figure
illustrate how the various aspects relate to the integrated assessment
framework for considering climate change (see Figure
SPM-1). |
|
Q3.18-20 |
|
Q3
Figure 3-1 |
| |
|
| Models of cereal crops indicate that in some temperate
areas potential yields increase with small increases in temperature but
decrease with larger temperature changes ( medium to low confidence). In
most tropical and subtropical regions, potential yields are projected to
decrease for most projected increases in temperature ( medium confidence). Where
there is also a large decrease in rainfall in subtropical and tropical dryland/rainfed
systems, crop yields would be even more adversely affected. These estimates
include some adaptive responses by farmers and the beneficial effects of
CO2 fertilization, but not the impact of projected increases
in pest infestations and changes in climate extremes. The ability of livestock
producers to adapt their herds to the physiological stresses associated
with climate change is poorly known. Warming of a few °C or more is
projected to increase food prices globally, and may increase the risk of
hunger in vulnerable populations. |
Q3.21 |
| |
|
| Climate change will exacerbate water shortages in
many water-scarce areas of the world.
Demand for water is generally increasing due to population growth
and economic development, but is falling in some countries because of increased
efficiency of use. Climate change is projected to substantially reduce available
water (as reflected by projected runoff) in many of the water-scarce areas
of the world, but to increase it in some other areas (medium confidence)
(see Figure SPM-4). Freshwater
quality generally would be degraded by higher water temperatures (high
confidence), but this may be offset in some regions by increased flows. |
Q3.22 |
| |
|
| The aggregated market sector effects, measured as
changes in gross domestic product (GDP), are estimated to be negative for
many developing countries for all magnitudes of global mean temperature
increases studied (low confidence), and are estimated to be mixed
for developed countries for up to a few °C warming (low confidence)
and negative for warming beyond a few degrees (medium to low confidence).
The estimates generally exclude the effects of changes in climate
variability and extremes, do not account for the effects of different rates
of climate change, only partially account for impacts on goods and services
that are not traded in markets, and treat gains for some as canceling out
losses for others. |
Q3.25 |
| |
|
| Populations that inhabit small islands and/or low-lying
coastal areas are at particular risk of severe social and economic effects
from sea-level rise and storm surges. Many human settlements will
face increased risk of coastal flooding and erosion, and tens of millions
of people living in deltas, in low-lying coastal areas, and on small islands
will face risk of displacement. Resources critical to island and coastal
populations such as beaches, freshwater, fisheries, coral reefs and atolls,
and wildlife habitat would also be at risk. |
Q3.23 |
| |
|
| The impacts of climate change will fall disproportionately
upon developing countries and the poor persons within all countries, and
thereby exacerbate inequities in health status and access to adequate food,
clean water, and other resources. Populations in developing countries
are generally exposed to relatively high risks of adverse impacts from climate
change. In addition, poverty and other factors create conditions of low
adaptive capacity in most developing countries. |
Q3.33 |
| |
|
| Adaptation has the potential to reduce
adverse effects of climate change and can often produce immediate ancillary
benefits, but will not prevent all damages.
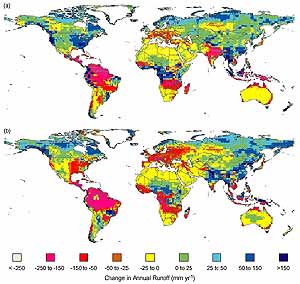 |
Figure SPM-4: Projected changes
in average annual water runoff by the year 2050, relative to average
runoff for the years 1961 to 1990, largely follow projected changes
in precipitation. Changes in runoff are calculated with a
hydrologic model using as inputs climate projections from two versions
of the Hadley Centre atmosphere-ocean general circulation model (AOGCM)
for a scenario of 1% per annum increase in effective CO2
concentration in the atmosphere: (a) HadCM2 ensemble mean and (b)
HadCM3. Projected increases in runoff in high latitudes and southeast
Asia and decreases in central Asia, the area around the Mediterranean,
southern Africa, and Australia are broadly consistent across the Hadley
Centre experiments, and with the precipitation projections of other
AOGCM experiments. For other areas of the world, changes in precipitation
and runoff are scenario- and model-dependent. |
|
Q3.26 |
|
Q3 Figure 3-5 |
| |
|
| Numerous possible adaptation options for responding
to climate change have been identified that can reduce adverse and enhance
beneficial impacts of climate change, but will incur costs.
Quantitative evaluation of their benefits and costs and how they
vary across regions and entities is incomplete. |
Q3.27 |
| |
|
| Greater and more rapid climate change would pose greater
challenges for adaptation and greater risks of damages than would lesser
and slower change. Natural and
human systems have evolved capabilities to cope with a range of climate
variability within which the risks of damage are relatively low and ability
to recover is high. However, changes in climate that result in increased
frequency of events that fall outside the historic range with which systems
have coped increase the risk of severe damages and incomplete recovery or
collapse of the system. |
Q3.28 |
|
|
 |
|
|
|
|
|
|
|