Changes have also occurred in other important aspects of climate.
- It is very likely7
that precipitation has increased by 0.5 to 1% per decade in the 20th century
over most mid- and high latitudes of the Northern Hemisphere continents, and
it is likely7
that rainfall has increased by 0.2 to 0.3% per decade over the tropical (10°N
to 10°S) land areas. Increases in the tropics are not evident over the
past few decades. It is also likely7
that rainfall has decreased over much of the Northern Hemisphere sub-tropical
(10°N to 30°N) land areas during the 20th century by about 0.3% per
decade. In contrast to the Northern Hemisphere, no comparable systematic changes
have been detected in broad latitudinal averages over the Southern Hemisphere.
There are insufficient data to establish trends in precipitation over the
oceans.
- In the mid- and high latitudes of the Northern Hemisphere over the latter
half of the 20th century, it is likely7
that there has been a 2 to 4% increase in the frequency of heavy precipitation
events. Increases in heavy precipitation events can arise from a number of
causes, e.g., changes in atmospheric moisture, thunderstorm activity and large-scale
storm activity.
- It is likely7
that there has been a 2% increase in cloud cover over mid- to high latitude
land areas during the 20th century. In most areas the trends relate well to
the observed decrease in daily temperature range.
- Since 1950 it is very likely7
that there has been a reduction in the frequency of extreme low temperatures,
with a smaller increase in the frequency of extreme high temperatures.

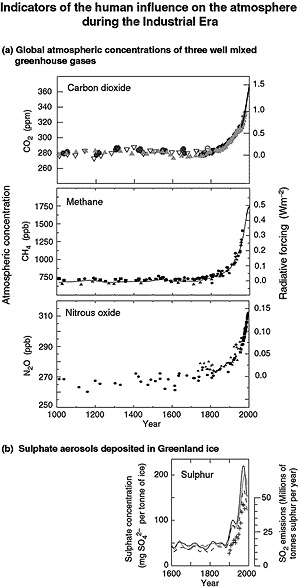
Figure 2: Long records of past changes in atmospheric composition
provide the context for the influence of anthropogenic emissions.
(a) shows changes in the atmospheric concentrations of carbon dioxide
(CO2), methane (CH4), and nitrous oxide (N2O)
over the past 1000 years. The ice core and firn data for several sites
in Antarctica and Greenland (shown by different symbols) are supplemented
with the data from direct atmospheric samples over the past few decades
(shown by the line for CO2 and incorporated in the curve
representing the global average of CH4). The estimated positive
radiative forcing of the climate system from these gases is indicated
on the right-hand scale. Since these gases have atmospheric lifetimes
of a decade or more, they are well mixed, and their concentrations reflect
emissions from sources throughout the globe. All three records show
effects of the large and increasing growth in anthropogenic emissions
during the Industrial Era.
(b) illustrates the influence of industrial emissions on atmospheric
sulphate concentrations, which produce negative radiative forcing. Shown
is the time history of the concentrations of sulphate, not in the atmosphere
but in ice cores in Greenland (shown by lines; from which the episodic
effects of volcanic eruptions have been removed). Such data indicate
the local deposition of sulphate aerosols at the site, reflecting sulphur
dioxide (SO2) emissions at mid-latitudes in the Northern
Hemisphere. This record, albeit more regional than that of the globally-mixed
greenhouse gases, demonstrates the large growth in anthropogenic SO2
emissions during the Industrial Era. The pluses denote the relevant
regional estimated SO2 emissions (right-hand scale).
[Based upon (a) Chapter 3, Figure
3.2b (CO2); Chapter 4, Figure
4.1a and b ( CH4) and Chapter
4, Figure 4.2 (N2O) and (b) Chapter
5, Figure 5.4a] |
- Warm episodes of the El Niño-Southern Oscillation
(ENSO) phenomenon (which consistently affects regional variations of precipitation
and temperature over much of the tropics, sub-tropics and some mid-latitude
areas) have been more frequent, persistent and intense since the mid-1970s,
compared with the previous 100 years.
- Over the 20th century (1900 to 1995), there were relatively small increases
in global land areas experiencing severe drought or severe wetness. In many
regions, these changes are dominated by inter-decadal and multi-decadal climate
variability, such as the shift in ENSO towards more warm events.
- In some regions, such as parts of Asia and Africa, the frequency and intensity
of droughts have been observed to increase in recent decades.
Some important aspects of climate appear not to have changed.
- A few areas of the globe have not warmed in recent decades, mainly over
some parts of the Southern Hemisphere oceans and parts of Antarctica.
- No significant trends of Antarctic sea-ice extent are apparent since 1978,
the period of reliable satellite measurements.
- Changes globally in tropical and extra-tropical storm intensity and frequency
are dominated by inter-decadal to multi-decadal variations, with no significant
trends evident over the 20th century. Conflicting analyses make it difficult
to draw definitive conclusions about changes in storm activity, especially
in the extra-tropics.
- No systematic changes in the frequency of tornadoes, thunder days, or hail
events are evident in the limited areas analysed.
Emissions of greenhouse gases and aerosols due to human activities continue
to alter the atmosphere in ways that are expected to affect the climate.
Changes in climate occur as a result of both internal variability within the
climate system and external factors (both natural and anthropogenic). The influence
of external factors on climate can be broadly compared using the concept of
radiative forcing8.
A positive radiative forcing, such as that produced by increasing concentrations
of greenhouse gases, tends to warm the surface. A negative radiative forcing,
which can arise from an increase in some types of aerosols (microscopic airborne
particles) tends to cool the surface. Natural factors, such as changes in solar
output or explosive volcanic activity, can also cause radiative forcing. Characterisation
of these climate forcing agents and their changes over time (see Figure
2) is required to understand past climate changes in the context of natural
variations and to project what climate changes could lie ahead. Figure
3 shows current estimates of the radiative forcing due to increased concentrations
of atmospheric constituents and other mechanisms.
Concentrations of atmospheric greenhouse gases and their radiative forcing
have continued to increase as a result of human activities.
- The atmospheric concentration of carbon dioxide (CO2) has increased
by 31% since 1750. The present CO2 concentration has not been exceeded
during the past 420,000 years and likely7
not during the past 20 million years. The current rate of increase is unprecedented
during at least the past 20,000 years.
- About three-quarters of the anthropogenic emissions of CO2 to
the atmosphere during the past 20 years is due to fossil fuel burning. The
rest is predominantly due to land-use change, especially deforestation.
- Currently the ocean and the land together are taking up about half of the
anthropogenic CO2 emissions. On land, the uptake of anthropogenic
CO2 very likely7
exceeded the release of CO2 by deforestation during the 1990s.
- The rate of increase of atmospheric CO2 concentration has been
about 1.5 ppm9
(0.4%) per year over the past two decades. During the 1990s the year to year
increase varied from 0.9 ppm (0.2%) to 2.8 ppm (0.8%). A large part of this
variability is due to the effect of climate variability (e.g., El Niño
events) on CO2 uptake and release by land and oceans.
- The atmospheric concentration of methane (CH4) has increased
by 1060 ppb9
(151%) since 1750 and continues to increase. The present CH4 concentration
has not been exceeded during the past 420,000 years. The annual growth in
CH4 concentration slowed and became more variable in the 1990s,
compared with the 1980s. Slightly more than half of current CH4
emissions are anthropogenic (e.g., use of fossil fuels, cattle, rice agriculture
and landfills). In addition, carbon monoxide (CO) emissions have recently
been identified as a cause of increasing CH4 concentration.
- The atmospheric concentration of nitrous oxide (N2O) has increased
by 46 ppb (17%) since 1750 and continues to increase. The present N2O
concentration has not been exceeded during at least the past thousand years.
About a third of current N2O emissions are anthropogenic (e.g.,
agricultural soils, cattle feed lots and chemical industry).
- Since 1995, the atmospheric concentrations of many of those halocarbon gases
that are both ozone-depleting and greenhouse gases (e.g., CFCl3
and CF2Cl2), are either increasing more slowly or decreasing,
both in response to reduced emissions under the regulations of the Montreal
Protocol and its Amendments. Their substitute compounds (e.g., CHF2Cl
and CF3CH2F) and some other synthetic compounds (e.g.,
perfluorocarbons (PFCs) and sulphur hexafluoride (SF6)) are also
greenhouse gases, and their concentrations are currently increasing.
- The radiative forcing due to increases of the well-mixed greenhouse gases
from 1750 to 2000 is estimated to be 2.43 Wm-2: 1.46 Wm-2
from CO2; 0.48 Wm-2 from CH4; 0.34 Wm-2
from the halocarbons; and 0.15 Wm-2 from N2O. (See Figure
3, where the uncertainties are also illustrated.)
- The observed depletion of the stratospheric ozone (O3) layer
from 1979 to 2000 is estimated to have caused a negative radiative forcing
(–0.15 Wm-2). Assuming full compliance with current halocarbon
regulations, the positive forcing of the halocarbons will be reduced as will
the magnitude of the negative forcing from stratospheric ozone depletion as
the ozone layer recovers over the 21st century.
- The total amount of O3 in the troposphere is estimated to have
increased by 36% since 1750, due primarily to anthropogenic emissions of several
O3-forming gases. This corresponds to a positive radiative forcing
of 0.35 Wm-2. O3 forcing varies considerably by region
and responds much more quickly to changes in emissions than the long-lived
greenhouse gases, such as CO2.
|

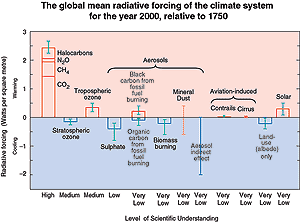
Figure 3: Many external factors force climate change. These radiative
forcings arise from changes in the atmospheric composition, alteration
of surface reflectance by land use, and variation in the output of the
sun. Except for solar variation, some form of human activity is linked
to each. The rectangular bars represent estimates of the contributions
of these forcings - some of which yield warming, and some cooling. Forcing
due to episodic volcanic events, which lead to a negative forcing lasting
only for a few years, is not shown. The indirect effect of aerosols shown
is their effect on the size and number of cloud droplets. A second indirect
effect of aerosols on clouds, namely their effect on cloud lifetime, which
would also lead to a negative forcing, is not shown. Effects of aviation
on greenhouse gases are included in the individual bars. The vertical
line about the rectangular bars indicates a range of estimates, guided
by the spread in the published values of the forcings and physical understanding.
Some of the forcings possess a much greater degree of certainty than others.
A vertical line without a rectangular bar denotes a forcing for which
no best estimate can be given owing to large uncertainties. The overall
level of scientific understanding for each forcing varies considerably,
as noted. Some of the radiative forcing agents are well mixed over the
globe, such as CO2, thereby perturbing the global heat balance.
Others represent perturbations with stronger regional signatures because
of their spatial distribution, such as aerosols. For this and other reasons,
a simple sum of the positive and negative bars cannot be expected to yield
the net effect on the climate system. The simulations of this assessment
report (for example, Figure 5) indicate that the estimated net effect
of these perturbations is to have warmed the global climate since 1750.
[Based upon Chapter 6, Figure
6.6]
|
|