| Working Group I: The Scientific Basis |
| Working Group I: The Scientific Basis |
|
|
|
| Other reports in this collection | |
Methane (CH4)
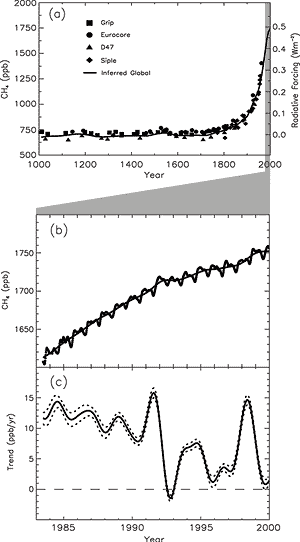
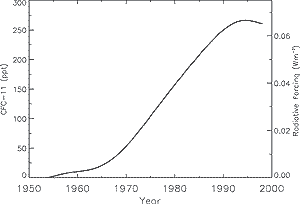
The atmospheric abundance of CH4 continues to increase, from about 1,610 ppb in 1983 to 1,745 ppb in 1998, but the observed annual increase has declined during this period. The increase was highly variable during the 1990s; it was near zero in 1992 and as large as 13 ppb during 1998. There is no clear quantitative explanation for this variability. Since the SAR, quantification of certain anthropogenic sources of CH4, such as that from rice production, has improved. The rate of increase in atmospheric CH4 is due to a small imbalance between poorly characterised sources and sinks, which makes the prediction of future concentrations problematic. Although the major contributors to the global CH4 budget likely have been identified, most of them are quite uncertain quantitatively because of the difficulty in assessing emission rates of highly variable biospheric sources. The limitations of poorly quantified and characterised CH4 source strengths inhibit the prediction of future CH4 atmospheric concentrations (and hence its contribution to radiative forcing) for any given anthropogenic emission scenario, particularly since both natural emissions and the removal of CH4 can be influenced substantially by climate change. Nitrous oxide (N2O) The atmospheric concentration of nitrous oxide (N2O) has steadily increased during the Industrial Era and is now 16% (46 ppb) larger than in 1750. The present N2O concentration has not been exceeded during at least the past thousand years. Nitrous oxide is another greenhouse gas with both natural and anthropogenic sources, and it is removed from the atmosphere by chemical reactions. Atmospheric concentrations of N2O continue to increase at a rate of 0.25%/yr (1980 to 1998). Significant interannual variations in the upward trend of N2O concentrations are observed, e.g., a 50% reduction in annual growth rate from 1991 to 1993. Suggested causes are several-fold: a decrease in use of nitrogen-based fertiliser, lower biogenic emissions, and larger stratospheric losses due to volcanic-induced circulation changes. Since 1993, the growth of N2O concentrations has returned to rates closer to those observed during the 1980s. While this observed multi-year variance has provided some potential insight into what processes control the behaviour of atmospheric N2O, the multi-year trends of this greenhouse gas remain largely unexplained.The global budget of nitrous oxide is in better balance than in the SAR, but uncertainties in the emissions from individual sources are still quite large. Natural sources of N2O are estimated to be approximately 10 TgN/yr (1990), with soils being about 65% of the sources and oceans about 30%. New, higher estimates of the emissions from anthropogenic sources (agriculture, biomass burning, industrial activities, and livestock management) of approximately 7 TgN/yr have brought the source/sink estimates closer in balance, compared with the SAR. However, the predictive understanding associated with this significant, long-lived greenhouse gas has not improved significantly since the last assessment. The radiative forcing is estimated at 0.15 Wm-2, which is 6% of the total from all of the long-lived and globally mixed greenhouse gases (see Figure 9). Halocarbons and related compoundsThe atmospheric concentrations of many of those gases that are both ozone-depleting and greenhouse gases are either decreasing (CFC-11, CFC-113, CH3CCl3 and CCl4) or increasing more slowly (CFC-12) in response to reduced emissions under the regulations of the Montreal Protocol and its Amendments. Many of these halocarbons are also radiatively effective, long-lived greenhouse gases. Halocarbons are carbon compounds that contain fluorine, chlorine, bromine or iodine. For most of these compounds, human activities are the sole source. Halocarbons that contain chlorine (e.g., chlorofluorocarbons - CFCs) and bromine (e.g., halons) cause depletion of the stratospheric ozone layer and are controlled under the Montreal Protocol. The combined tropospheric abundance of ozone-depleting gases peaked in 1994 and is slowly declining. The atmospheric abundances of some of the major greenhouse halocarbons have peaked, as shown for CFC-11 in Figure 12. The concentrations of CFCs and chlorocarbons in the troposphere are consistent with reported emissions. Halocarbons contribute a radiative forcing of 0.34 Wm-2, which is 14% of the radiative forcing from all of the globally mixed greenhouse gases (Figure 9). The observed atmospheric concentrations of the substitutes for the CFCs are increasing, and some of these compounds are greenhouse gases. The abundances of the hydrochlorofluorocarbons (HCFCs) and hydrofluorocarbons (HFCs) are increasing as a result of continuation of earlier uses and of their use as substitutes for the CFCs. For example, the concentration of HFC-23 has increased by more than a factor of three between 1978 and 1995. Because current concentrations are relatively low, the present contribution of HFCs to radiative forcing is relatively small. The present contribution of HCFCs to radiative forcing is also relatively small, and future emissions of these gases are limited by the Montreal Protocol. The perfluorocarbons (PFCs, e.g., CF4 and C2F6) and sulphur hexafluoride (SF6) have anthropogenic sources, have extremely long atmospheric residence times, and are strong absorbers of infrared radiation. Therefore, these compounds, even with relatively small emissions, have the potential to influence climate far into the future. Perfluoromethane (CF4) resides in the atmosphere for at least 50,000 years. It has a natural background; however, current anthropogenic emissions exceed natural ones by a factor of 1,000 or more and are responsible for the observed increase. Sulphur hexafluoride (SF6) is 22,200 times more effective a greenhouse gas than CO2 on a per-kg basis. The current atmospheric concentrations are very small (4.2 ppt), but have a significant growth rate (0.24 ppt/yr). There is good agreement between the observed atmospheric growth rate of SF6 and the emissions based on revised sales and storage data. |
|
Other reports in this collection |