| Working Group I: The Scientific Basis |
| Working Group I: The Scientific Basis |
|
|
|
| Other reports in this collection | |
|
2.5.3 Water Vapour
Although measurement problems hinder the analysis of long-term water vapour changes (Elliott, 1995; Rind, 1998), several recent studies tend to confirm and extend the findings of lower tropospheric water vapour increases reported in the SAR. Furthermore, new analyses indicate upward trends in near-surface humidity. Knowledge about changes in water vapour at upper tropospheric and lower stratospheric levels is of great importance because strong alterations in radiative forcing can result from small absolute changes in water vapour at these levels (Chapters 6 and 7). New data presented here from the SPARC WAVAS (Stratospheric Processes and their Role in Climate / Water Vapour Assessment) project (Kley et al., 2000) are starting to cast light on changes at these levels. Note that water vapour pressure, and specific humidity (for a constant relative humidity) increase non-linearly with increasing temperature. 2.5.3.1 Surface water vapourWater vapour pressure, dew-point or relative humidity at the surface is conventionally measured using wet and dry bulb thermometers exposed in thermometer screens at climate stations. The quality of these data has been little studied. Wet bulb thermometers are not usually aspirated, so that the cooling of the wet bulb, and therefore the deduced specific or relative humidity, depends on the flow rate of air within the screen. This may often differ from the assumed airflow. Occasionally wet bulbs may dry out. Thus it is not possible to judge fully the accuracy of surface vapour pressure trends presented here. Schönwiese et al. (1994) and Schönwiese and Rapp (1997) found small increases in surface vapour pressure over most of Europe from 1961 to 1990. The annual trends are weak. Statistically significant changes are confined to increases of about 0.5 to 1.5 hPa (relative to mean values of 12 to 15 hPa) in the southern and eastern Mediterranean region (with the largest increase in summer) and decreases of about 0.5 hPa over parts of Turkey (mainly in springtime). Specific humidity trends over the United States were overwhelmingly positive for the period 1961 to 1995, with magnitudes of several per cent per decade, and with the largest and most statistically significant trends in spring and summer (Gaffen and Ross, 1999). Night-time specific humidity trends were generally stronger than daytime trends. Relative humidity showed smaller increases, especially in winter and spring. The specific humidity and derived dew point trends are broadly consistent, both spatially and in their day-night differences, with temperature trends. Schwartzman et al. (1998) found that the diurnal dewpoint cycle is changing over North America, with a relative decline in late afternoon and a small rise at midday.
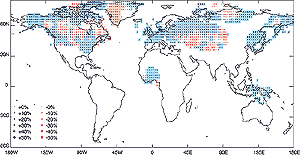
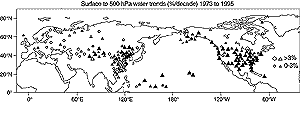
Increases in water vapour over the former Soviet Union, Eastern China, the United States and tropical Western Pacific islands have been found in some seasons by Sun et al. (2000) in the second half of the 20th century, but with decreases in Canada in autumn. The selective character of the findings prevents any assessment of statistical significance. Wang and Gaffen (2001) found that specific humidity trends over China were overwhelmingly positive over 1951 to 1994, with the largest and most statistically significant trends in north-west China north of 35°N and west of 105°E. Trends were larger in summer and night-time trends were generally larger than daytime ones. Recently New et al. (2000) have estimated linear trends for annual and seasonal values of surface vapour pressure over land using calculated monthly vapour pressure data from climate stations. Figure 2.26 shows trends for the 21 years from 1975 to 1995, corresponding to much of the recent period of global warming described in Section 2.2.2.3. Although the uncertain quality of the data prevents any definitive conclusions about statistical significance, nominal significance of trends at the 5% level was estimated after smoothing the annual data to reduce the influence of outliers at the beginning and end of this short series. Few Southern Hemisphere data have been analysed, but Figure 2.26 shows that there have been widespread nominally significant increases in annual mean water vapour in the Northern Hemisphere. These increases are reflected in the individual seasons, although nominally significant annual mean increases are more extensive. Regional decreases over eastern Canada are explained by colder conditions in the winter half year associated with the increasingly positive phase of the North Atlantic Oscillation (Section 2.6.5). 2.5.3.2 Lower-tropospheric water vapourRadiosonde and satellite observations of water vapour above the surface have been analysed for evidence of long-term change. Both data sources have had serious data quality and temporal homogeneity problems (Elliott, 1995), although recent work to determine trends in water vapour from the surface to 500 hPa since 1973 has been based on radiosonde data judged to be largely unaffected by these problems (Ross and Elliott, 2001). Published satellite data are insufficiently homogeneous or too short in length to deduce reliable trends or low-frequency variations.
Radiosonde observations Zhai and Eskridge (1997) found increases of about 1 to 3%/decade in surface-to-200 hPa precipitable water over China for 1970 to 1990. Increases were most significant in spring. Percentage trends were larger over the 700 to 400 hPa layer than the surface-700 hPa layer. Gutzler (1996) found that specific humidity data at 1,000, 700, and 300 hPa at four western tropical Pacific radiosonde stations from 1973 to 1993 gave increases of 3 to 9%/decade, with larger percentage increases at increasing height above the surface. In contrast, Peixoto and Oort (1996) found decreases in zonal mean relative humidity between 1974 and 1988. The decreases are more marked at 300 hPa, where they are more likely to be associated with instrument changes than at lower levels, and are more pronounced at higher latitudes than in the tropics. |
|
Other reports in this collection |