|
3.3.3 Variations in Atmospheric CO2 during the Past 11,000 Years
Natural variations in CO2 during the past 11,000 years (Figure
3.2c) have been small (about 20 ppm) according to the best available measurements,
which are from the Taylor Dome ice core (Smith et al., 1999; Indermühle
et al., 1999). These measurements show a short-lived maximum around 11 kyr BP,
followed by a slight fall, which may have been caused by increasing carbon storage
in the terrestrial biosphere. Atmospheric CO2 concentration was about
260 ppm at its Holocene minimum around 8 kyr BP and increased towards about
280 ppm in the pre-industrial period. The same pattern and the same CO2
concentration levels over the past 8 kyr have also been shown in another ice
core, BH7 near Vostok (Peybernès et al., 2000). The causes of these changes
are not known. Preliminary  13C
measurements (see Box 3.6) suggest that this increase may
have been due to a gradual reduction in terrestrial carbon storage (Indermühle
et al., 1999; Smith et al., 1999) but others have considered an oceanic explanation
more likely. 13C
measurements (see Box 3.6) suggest that this increase may
have been due to a gradual reduction in terrestrial carbon storage (Indermühle
et al., 1999; Smith et al., 1999) but others have considered an oceanic explanation
more likely.
Atmospheric CO2 concentrations have also been reconstructed indirectly,
from stomatal index measurements on sub-fossil leaves (Van de Water et al.,
1994; Beerling et al., 1995; Rundgren and Beerling, 1999; Wagner et al., 1999).
Stomatal density and stomatal index of many species respond to atmospheric CO2
(Woodward, 1987; Woodward and Bazzaz, 1988) but are influenced by other environmental
variables as well (Poole et al., 1996). One recent stomatal index record, interpreted
as implying high (up to 350 ppm) and rapidly fluctuating CO2 concentrations
in the early Holocene (Wagner et al., 1999), is clearly incompatible with the
ice core record of Indermühle et al. (1999), whereas a continuous stomatal
index record from 9 kyr BP onwards (Rundgren and Beerling, 1999) has shown concentration
trends consistent with the ice-core records.
Figure 3.2b shows the excellent agreement among different high-resolution Antarctic
ice cores covering the past 1,000 years. Atmospheric CO2 concentration
fell by about 8 to 10 ppm during the Little Ice Age (from 1280 to 1860, see
Chapter 2) (Figure. 3.2b,
c; Barnola et al., 1995; Etheridge et al., 1996; Indermühle et al., 1999;
Rundgren and Beerling, 1999). A slight contemporaneous increase in 13C
of atmospheric CO2 has led to the suggestion that this effect was
caused by enhanced carbon storage on land (Francey et al., 1999b; Trudinger
et al., 1999).
|
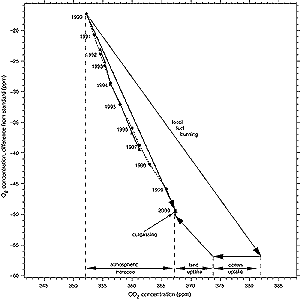
Figure 3.4: Partitioning of fossil fuel CO2 uptake
using O2 measurements (Keeling and Shertz, 1992; Keeling et
al., 1993; Battle et al., 1996, 2000; Bender et al., 1996; Keeling et
al., 1996b; Manning, 2001). The graph shows the relationship between changes
in CO2 (horizontal axis) and O2 (vertical axis).
Observations of annual mean concentrations of O2, centred on
January 1, are shown from the average of the Alert and La Jolla monitoring
stations (Keeling et al., 1996b; Manning, 2001; solid circles) and from
the average of the Cape Grim and Point Barrow monitoring stations (Battle
et al., 2000; solid triangles). The records from the two laboratories,
which use different reference standards, have been shifted to optimally
match during the mutually overlapping period. The CO2 observations
represent global averages compiled from the stations of the NOAA network
(Conway et al., 1994) with the methods of Tans et al. (1989). The arrow
labelled �fossil fuel burning� denotes the effect of the combustion
of fossil fuels (Marland et al., 2000; British Petroleum, 2000) based
on the relatively well known O2:CO2 stoichiometric
relation of the different fuel types (Keeling, 1988). Uptake by land and
ocean is constrained by the known O2:CO2 stoichiometric
ratio of these processes, defining the slopes of the respective arrows.
A small correction is made for differential outgassing of O2
and N2 with the increased temperature of the ocean as estimated
by Levitus et al. (2000).
|
3.3.4 Implications
The Vostok record of atmospheric CO2 and Antarctic climate is consistent
with a view of the climate system in which CO2 concentration changes
amplify orbitally-induced climate changes on glacial/inter-glacial time-scales
(Shackleton, 2000). Changes during the present inter-glacial (until the start
of the anthropogenic CO2 rise) have been small by comparison. Although
complete explanations for these changes in the past are lacking, high-resolution
ice core records establish that the human-induced increase of atmospheric CO2
over the past century is at least an order of magnitude faster than has occurred
during the preceeding 20,000 years.
| Box 3.6: Stable carbon isotopes in atmospheric CO2.
13C, a
measure of the relative abundance of the two stable carbon isotopes, 13C
and 12C, in atmospheric CO2 gives in principle similar
possibilities to O2 for the partitioning of atmospheric CO2
uptake (Keeling et al., 1979, 1980; Mook et al., 1983; Keeling et al.,
1989; Francey et al., 1995; Keeling et al., 1995). The principle of using
d13C to separate land and ocean components of the carbon budget relies
on the fractionation during photosynthesis by C3 plants, which discriminates
against 13C. This fractionation leads to biospheric carbon
being depleted in 13C by about 18‰ relative to the atmosphere. In
contrast, exchanges with the ocean involve relatively small fractionation
effects. Changes in the 13C/12C ratio of atmospheric
CO2 thus indicate the extent to which concurrent CO2
variations can be ascribed to variations in biospheric uptake. The calculation
also requires specification of the turnover times of carbon in the ocean
and on land, because fossil fuel burning implies a continuous release
of isotopically light carbon to the atmosphere. This leads to a lowering
of the atmospheric 13C/12C isotope ratio, which
takes years to centuries to work its way through the carbon cycle (Keeling
et al., 1980; Tans et al., 1993; Ciais et al., 1995a,b).
There are some complications. C3 plants discriminate against 13C more
strongly than C4 plants (Lloyd and Farquhar, 1994), thus the distributions
of C3 and C4 photosynthesis need to be known. The oceanic disequilibrium
can in principle be estimated observationally (Tans et al., 1993; Heimannn
and Maier-Reimer, 1996; Bacastow et al., 1996; Gruber et al., 1999), while
the terrestrial disequilibrium has to be estimated by means of models
(e.g., Ciais et al., 1999). Langenfelds et al. (1999) and Battle et al.
(2000) have shown that recently estimated values for the disequilibrium
terms lead to consistency between the partitioning of CO2 uptake
into land and ocean uptake based on O2 and on d13C
measurements.
|
|