3.6.2.2 Uptake and release of anthropogenic CO2 by the land
The most comprehensive model-based estimates of the terrestrial components
of the anthropogenic CO2 budget are those that have been produced
by the CCMLP. McGuire et al. (2001) used two TBMs and two DGVMs driven by changes
in atmospheric CO2, then changes in CO2 with historical
changes in climate (from observations), and finally changes in CO2
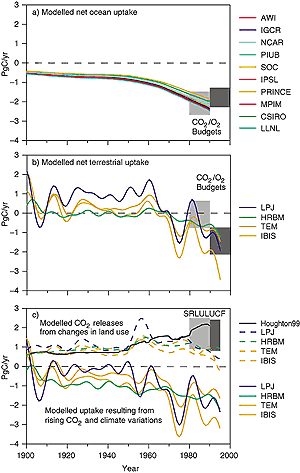
and climate with land-use change from Ramankutty and Foley (2000) (Figure
3.8; Table 3.4). In these simulations, CO2
fertilisation accounted for a land-atmosphere flux of -0.9 to -3.1 PgC/yr, land-use
change a positive flux of 0.6 to 1.0 PgC/yr, and climate variability a small
additional effect of uncertain sign, -0.2 to 0.9 PgC/yr during the 1980s. The
total land-atmosphere flux simulated for the 1980s amounted to -0.3 to -1.5
PgC/yr, which is consistent with or slightly more negative than the observationally-based
estimate of -0.2 ± 0.7 PgC/yr (Table 3.1).
Net uptake by all models reported in McGuire et al. (2001) is shown to be occurring
mainly in tropical, temperate and boreal forests - consistent with forest inventory
data (Section 3.5.4) – while some regions (notably
semi-arid tropical and sub-tropical regions) show net carbon loss. The model
estimates of the CO2 source due to land-use change are substantially
smaller than the estimate of Houghton (1999) (Section
3.4.2). This divergence primarily reflects disagreements between the Houghton
(1999) and Ramankutty and Foley (2000) data sets as to the timing of tropical
deforestation in different regions (see Section 3.4.2).
|

Figure 3.8: Modelled fluxes of anthropogenic CO2 over
the past century. (a) Ocean model results from OCMIP (Orr and Dutay, 1999;
Orr et al., 2000); (b), (c) terrestrial model results from CCMLP (McGuire
et al., 2001). Positive numbers denote fluxes to the atmosphere; negative
numbers denote uptake from the atmosphere. The ocean model results appear
smooth because they contain no interannual variability, being forced only
by historical changes in atmospheric CO2. The results are truncated
at 1990 because subsequent years were simulated using a CO2
concentration scenario rather than actual measurements, leading to a likely
overestimate of uptake for the 1990s. The terrestrial model results include
effects of historical CO2 concentrations, climate variations,
and land-use changes based on Ramankutty and Foley (2000). The results
were smoothed using a 10-year running mean to remove short-term variability.
For comparison, grey boxes denote observational estimates of CO2
uptake by the ocean in panel (a) and by the land in panel (b) (from Table
3.1). Land-use change flux estimates from Houghton et al. (1999) are
shown by the black line in panel (c). The grey boxes in panel (c) indicate
the range of decadal average values for the land-use change flux accepted
by the SRLULUCF (Bolin et al., 2000) for the 1980s and for 1990 to 1995.
|
There is no general agreement on how to model the linkage between reactive
nitrogen deposition and vegetation productivity, and recent model estimates
of the additional effect of anthropogenic nitrogen fertilisation on the global
carbon cycle vary widely. The anthropogenic nitrogen input itself (Holland et
al., 1999), the fate of anthropogenic nitrogen in the ecosystem (Nadelhoffer
et al., 1999; Jenkinson et al., 1999), and changes in ecosystem nitrogen fixation
(Vitousek and Field, 1999) represent major sources of uncertainty. Estimates
of the anthropogenic nitrogen effect range from -0.2 PgC/yr (Nadelhoffer et
al., 1999) to -1.1 or -1.4 PgC/yr (Holland et al., 1997). The model with the
smallest CO2 fertilisation effect (-0.9 PgC/yr) in the McGuire et
al. (2001) study has been shown to respond strongly to anthropogenic nitrogen
input, yielding a combined (CO2 and nitrogen) fertilisation effect
of -1.5 PgC/yr. A modelling study by Lloyd (1999) suggests that CO2
and nitrogen fertilisation effects may by synergistic. Evaluation of model results
on carbon-nitrogen coupling against experimental results is a current research
focus.
|