| Working Group I: The Scientific Basis |
| Working Group I: The Scientific Basis |
|
|
|
| Other reports in this collection | |
| Continued from previous page
Modelled aerosol optical depths near 10°N are dominated by dust with some contribution from organic carbon and sulphate (especially in January and April). They are systematically lower (by, on average, 0.08) than the average retrieved optical depth. The discrepancy between modelled and retrieved optical depths in this region, however, would be reduced if the sea salt fluxes derived from SSM/I winds and larger DMS fluxes had been used.
The modelled aerosol optical depths from 10°S to 30°S
are due to a combination of different aerosol types. They are systematically
lower than the average of the retrieved optical depths by an average of 0.06
with biases ranging from -0.14 to 0.01 in January, from -0.12 to -0.02 in April,
from -0.13 to 0.07 in July and from -0.11 to 0.06 in October. As shown by the
sensitivity study, much of the difference between the modelled and retrieved
zonal average optical depths could be removed by using higher sea salt and DMS
fluxes. However, the spatial character of the differences reveals that the cause
of the discrepancies probably cannot be attributed to any single source. For
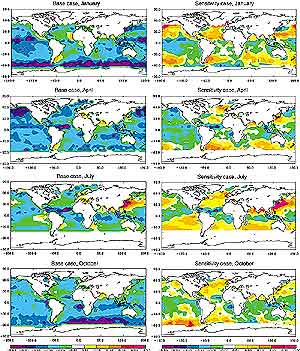
example, Figure 5.12 shows the difference between the
base case and sensitivity case for the ECHAM/GRANTOUR model and the optical
depths retrieved by Mishchenko et al. (1999). In January the differences are
largest in the central Pacific Ocean. In April the differences appear largest
in the Pacific Ocean and in the Indian Ocean west of Australia. In July and
October the differences are mainly to the west and east of the African continent
and also in the mid-Pacific Ocean and west of South America in October. We note
that the large overprediction of optical depth in both the base case and the
sensitivity case off the coast of Asia in July may be due to the difference
in simulated year and the year of the optical depth retrievals. The model simulations
used anthropogenic sulphate emissions appropriate to 2000 while the retrievals
refer to an average of 1985 to 1988 data. Modelled aerosol optical depths near 60°S are dominated by sea salt. This component appears to be reasonably well represented by the models, especially for the optical depths predicted using the SSM/I sea salt fluxes. However, if some of the other models had used the higher fluxes used in the GSFC model, the optical depths would be overpredicted in this region. Haywood et al. (1999) found a large and significant difference between modelled
and observed reflectivity at northern latitudes when higher sea salt fluxes
based on the algorithm used here were used together with the SSM/I-derived winds.
The use of this algorithm corrected a significant underprediction of reflected
radiation in mid-ocean regions when the sea salt parametrization of Lovett (1978)
was used. We used the aerosol burdens from the models in the IPCC intercomparison
to scale the optical depths in the Haywood et al. study in order to compare
the average reflected radiation from each of the models in the intercomparison
with that from the ERBE satellite. For the GSFC model which also used winds
derived from the SSM/I, results similar to those reported by Haywood et al.
(1999) were found (i.e. an overpredicted flux at northern latitudes, but no
large biases elsewhere). For the other models, the reflected radiation in mid-ocean
regions was under-predicted relative to ERBE, but the area of underprediction
was not as large as the area of underprediction for the GFDL model with the
low sea salt option. For these models, the predicted reflected radiation for
the region north of 30°N was sometimes higher than that from the ERBE satellite,
but this was not consistent across all models. In general, this analysis showed
that the comparison of model results with the reflected radiation from ERBE
is broadly consistent with that developed above for the comparison between modelled
and AVHRR-retrieved aerosol optical depth. In summary, analysis of the AVHRR comparisons indicates that significant uncertainties remain in both our ability to retrieve aerosol optical thickness from satellites and in our ability to model aerosol effects on the radiation budget. For example, there is a global average difference between the optical depth retrieved by Mishchenko et al. (1999) and that retrieved by Stowe et al. (1997) of 0.05 and a difference between Nakajima et al. (1999) and Stowe et al. (1997) of 0.03. The global average difference between the average optical depth from the models and the average optical depth from the satellite retrieval is of the same magnitude, namely -0.04. In the region 10°S to 30°S, the analysis indicates that modelled optical depths are consistently too low. Such a model underestimate might indicate that the retrieved optical depth from satellites is too high, for example, because the cloud screening algorithm is not adequate in this region. Alternatively, there may be a need for a larger source of aerosols in this region or for smaller modelled removal rates. |
|
Other reports in this collection |