10.5.1.3 Climate variability and extreme events
A number of studies have investigated the interannual variability in RCM simulations
driven by analyses of observations over different regions (e.g., Lüthi
et al., 1996 for Europe; Giorgi et al., 1996 and Giorgi and Shields 1999 for
the continental USA; Sun et al., 1999 for East Africa; Small et al., 1999a for
central Asia; Rinke et al., 1999 for the Arctic; van Lipzig, 1999 for Antarctica).
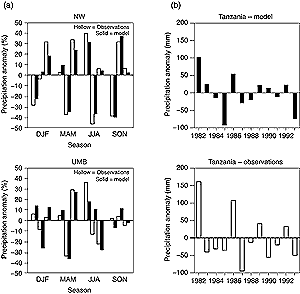
These show that RCMs can reproduce well interannual anomalies of precipitation
and surface air temperature, both in sign and magnitude, over sub-regions varying
in size from a few hundred kilometres to about 1,000 km (Figure
10.11).
At the intra-seasonal scale, the timing and positioning of regional climatological
features such as the East Asia rain belt and the Baiu front can be reproduced
with a high degree of realism with an RCM (Fu et al., 1998). A good simulation
of the intra-seasonal evolution of precipitation during the short rain season
of East Africa has also been documented (Sun et al., 1999). However, at shorter
time-scales, Dai et al. (1999) found that, despite a good simulation of average
precipitation, significant problems were exhibited by an RCM simulation of the
observed diurnal cycle of precipitation over different regions of the USA.
Only a few examples are available of analysis of variability in RCMs driven
by GCMs. At the intra-seasonal scale, Bhaskaran et al. (1998) showed that the
leading mode of sub-seasonal variability of the South Asia monsoon, a 30 to
50 day oscillation of circulation and precipitation anomalies, was more realistically
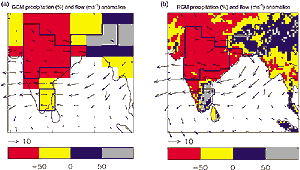
captured by an RCM than the driving GCM. Hassell and Jones (1999) then showed
that a nested RCM captured observed precipitation anomalies in the active break
phases of the South Asia monsoon (5 to 10 periods of anomalous circulations
and precipitation) that were absent from the driving GCM (Figure
10.12).
At the daily time-scale, some studies have shown that nested RCMs tend to simulate
too many light precipitation events compared with station data (Christensen
et al. 1998; Kato et al., 2001). However, RCMs produce more realistic statistics
of heavy precipitation events than the driving GCMs, sometimes capturing extreme
events entirely absent in the GCMs (Christensen et al., 1998; Jones, 1999).
Part of this is due to the inherent disaggregation of grid-box mean values resulting
from the RCM’s higher horizontal resolution. However, in one study, even
when aggregated to the GCM grid scale, the RCM was closer to observations than
the driving GCM (Durman et al., 2001).

Figure 10.11: Examples of seasonal precipitation anomalies
simulated with RCMs driven by analyses of observations over different
regions. In all cases the anomalies are calculated as the difference
between the precipitation of an individual season and the average
for the seasonal value for the entire simulation. (a) (top) Northwestern
USA (NW), and (bottom) Upper Mississippi Basin (UMB) for a three year
simulation (1993 to 1996) over the continental USA. The three pairs
of observed (hollow bars) and simulated (solid bars) anomalies for
each season are grouped in sequential order from 1993 to 1996. Units
are percentage of the three-year seasonal average (from Giorgi and
Shields, 1999, Figure 9). (b) Precipitation anomalies for twelve short-rains
periods over Tanzania for the October-December season: (top) model
simulation, and (bottom) observations. Units are mm. (From Sun et
al., 1999). |
|

Figure 10.12: Relative characteristics of break and active
precipitation composites of the Indian monsoon as simulated by (a)
GCM and (b) RCM. Each field is the difference in the break and active
composite precipitation as a percentage of the full mean. Overlaid
are the 850 hPa wind anomalies (break composite minus active composite,
units ms-1). Regions marked where observed ratios are <-50% (central
India) and >+50% (Tamil Nadu and north-eastern India) according
to Hamilton (1977). From Hassel and Jones (1999). |
|
|