12.2.3.2 Climatic response to natural forcing
Response to volcanic forcing
The climate response to several recent volcanic eruptions has been studied in
observations and simulations with atmospheric GCMs (e.g., Robock and Mao, 1992,
1995; Graf et al., 1996; Hansen et al., 1996; Kelly et al., 1996; Mao and Robock,
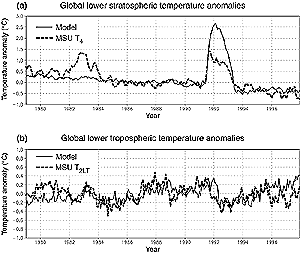
1998; Kirchner et al., 1999). The stratosphere warms and the annual mean surface
and tropospheric temperature decreases during the two to three years following
a major volcanic eruption. A simulation incorporating the effects of the Mt.
Pinatubo eruption and observed changes in stratospheric ozone in addition to
anthropogenic forcing approximately reproduces the observed stratospheric variations
(Figure 12.4; Bengtsson et al., 1999). It shows stratospheric
warming after the volcanic eruption, superimposed on a long-term cooling trend.
Although the surface temperature response in the Northern Hemisphere warm season
following a volcanic eruption is dominated by global scale radiative cooling,
some models simulate local warming over Eurasia and North America in the cold
season due to changes in circulation (e.g., Graf et al., 1996; Kirchner et al.,
1999). Variability from other sources makes assessment of the observed climate
response difficult, particularly as the two most recent volcanic eruptions (Mt.
Pinatubo and El Chichon) occurred in El Niño-Southern Oscillation (ENSO)
warm years. Simulations with simple models (Bertrand et al., 1999; Crowley and
Kim, 1999; Grieser and Schoenwiese, 2001) and AOGCMs (Tett et al., 1999; Stott
et al., 2001) produce a small decadal mean cooling in the 1980s and 1990s due
to several volcanic eruptions in those decades. Some simulations also produce
global warming in the early 20th century as a recovery from a series of strong
eruptions around the turn of the 20th century. It is unclear whether such a
long-term response is realistic.
Response to solar forcing
Since the SAR, there have been new modelling and observational studies on the
climate effects of variations in solar irradiance. The surface temperature response
to the 11-year cycle is found to be small (e.g., Cubasch et al., 1997; White
et al., 1997; North and Stevens, 1998; Crowley and Kim, 1999; Free and Robock,
1999). Low-frequency solar variability over the last few hundred years gives
a stronger surface temperature response (Cubasch et al., 1997; Drijfhout et
al., 1999; Rind et al., 1999; Tett et al., 1999; Stott et al., 2001). Model
results show cooling circa 1800 due to the hypothesised solar forcing minimum
and some warming in the 20th century, particularly in the early 20th century.
Time-dependent experiments produce a global mean warming of 0.2 to 0.5°C
in response to the estimated 0.7 Wm-2 change of solar radiative forcing
from the Maunder Minimum to the present (e.g., Lean and Rind, 1998, Crowley
and Kim, 1999).
Ozone changes in the Earth’s atmosphere caused by the 11-year solar cycle could
affect the temperature response in the free atmosphere. A relation between 30
hPa geopotential and a solar index has been shown over nearly four solar cycles
by Labitzke and van Loon (1997). Van Loon and Shea (1999, 2000) found a related
connection between upper to middle tropospheric temperature and a solar index
over the last 40 years, which is particularly strong in July and August. Variations
in ozone forcing related to the solar cycle may also affect surface temperature
via radiative and dynamical processes (see discussion in Chapter
6; Haigh, 1999; Shindell et al., 1999, 2001), but observational evidence
remains ambiguous (e.g., van Loon and Shea, 2000). The assessment of ozone-related
Sun-climate interactions is uncertain as a result of the lack of long-term,
reliable observations. This makes it difficult to separate effects of volcanic
eruptions and solar forcing on ozone. There has also been speculation that the
solar cycle might influence cloudiness and hence surface temperature through
cosmic rays (e.g., Svensmark and Friis-Christensen, 1997; Svensmark, 1998).
The latter effect is difficult to assess due to limitations in observed data
and the shortness of the correlated time-series.
As discussed earlier in Section 12.2.3, differences between
the response to solar and greenhouse gas forcings would make it easier to distinguish
the climate response to either forcing. However, the spatial response pattern
of surface air temperature to an increase in solar forcing was found to be quite
similar to that in response to increases in greenhouse gas forcing (e.g., Cubasch
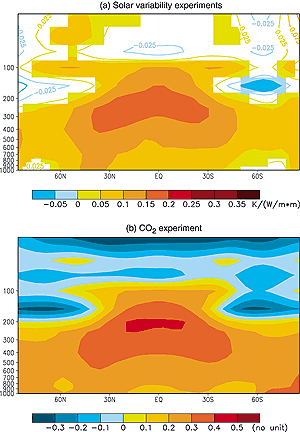
et al., 1997). The vertical response to solar forcing (Figure
12.5) includes warming throughout most of the troposphere. The response
in the stratosphere is small and possibly locally negative, but less so than
with greenhouse gas forcing, which gives tropospheric warming and strong stratospheric
cooling. The dependence of solar forcing on wavelength and the effect of solar
fluctuations on ozone were generally omitted in these simulations. Hence, the
conclusion that changes in solar forcing have little effect on large-scale stratospheric
temperatures remains tentative.

Figure 12.4: (a) Observed microwave sounding unit (MSU) global
mean temperature in the lower strato sphere, shown as dashed line,
for channel 4 for the period 1979 to 97 compared with the average
of several atmosphere-ocean GCM simulations starting with different
atmospheric conditions in 1979 (solid line). The simulations have
been forced with increasing greenhouse gases, direct and indirect
forcing by sulphate aerosols and tropospheric ozone forcing, and Mt.
Pinatubo volcanic aerosol and stratospheric ozone variations. The
model simula-tion does not include volcanic forcing due to El Chichon
in 1982, so it does not show stratospheric warming then. (b) As for
(a), except for 2LT temperature retrievals in the lower troposphere.
Note the steady response in the stratosphere, apart from the volcanic
warm periods, and the large variability in the lower troposphere (from
Bengtsson et al., 1999). |
|

Figure 12.5: (a) Response (covariance, normalised by the variance
of radiance fluctuations) of zonally averaged annual mean atmospheric
temperature to solar forcing for two simulations with ECHAM3/LSG.
Coloured regions indicate locally significant response to solar forcing.
(b) Zonal mean of the first EOF of greenhouse gas-induced temperature
change simulated with the same model (from Cubasch et al., 1997).
This indicates that for ECHAM3/LSG, the zonal mean temp-erature response
to greenhouse gas and solar forcing are quite different in the stratosphere
but similar in the troposphere. |
|
The different time-histories of the solar and anthropogenic forcing should
help to distinguish between the responses. All reconstructions suggest a rise
in solar forcing during the early decades of the 20th century with little change
on inter-decadal time-scales in the second half. Such a forcing history is unlikely
to explain the recent acceleration in surface warming, even if amplified by
some unknown feedback mechanism.
Continues on next page
|