8.2. Climate Change and Extreme Events that are Relevant to the Financial
Services Sector
8.2.1. Present-Day Conditions

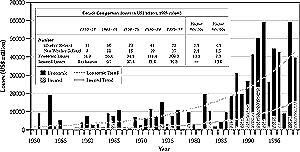
Figure 8-1: The costs of catastrophic weather events have exhibited
a rapid upward trend in recent decades. Yearly economic losses from large
events increased 10.3-fold from US$4 billion in the 1950s to US$40 billion
per year in the 1990s (all in 1999 US$). The insured portion of these losses
rose from a negligible level to US$9.2 billion annually during the same
period, and the ratio of premiums to catastrophe losses fell by two-thirds.
Notably, costs are larger by a factor of 2 when losses from ordinary, noncatastrophic
weather-related events are included (e.g., as shown in Figure
8-6). The numbers generally include "captive" self-insurers but not
the less-formal types of self-insurance (Munich Re, 2000). |
Present-day impacts of weather events on financial services
are caused mainly by extreme events. Differences in vulnerability exist, caused
by geographical location, population distribution, and national wealth. In developing
countries, there may be very high mortality from extreme weather but relatively
small costs to the financial sector because of low insurance penetration. In
developed nations, the loss of life may be much less but may have enormous—even
catastrophic—costs to the insurance industry (see Section
8.3.1). Swiss Re (2000b) has compiled lists of the 40 worst catastrophes
between 1970 and 1999 in terms of insurance losses and fatalities. These lists
show that:
- Of the 40 worst insured losses since 1970, only six were not weather related.
- Nineteen of the weather-related catastrophes affected the United States.
- Twenty-eight were related to windstorm (tropical and temperate latitudes).
In contrast, of the 40 worst events in terms of fatalities, only 16 were weather
related, of which 13 occurred in Asia. A list of natural disasters causing billion-dollar
losses drawn up by Munich Re (2000; see Table 8-3)
shows that, of 30 such disasters, 15 affected the United States and seven affected
Europe. Eighteen were related to windstorm. With the exception of earthquakes,
all were weather related.
In recent decades, economic and insured losses related to weather extremes
have increased rapidly (see Figure 8-1). An important part
of this trend is related to socioeconomic factors; another part may be explained
by climatic factors. Where trends in climate variables do occur, there are two
possible principle causes:
- Variability in the natural modes of variability of the global climate system—for
example, the Southern Oscillation, with its two characteristic modes of El
Niño and La Niña. In the 1980s and 1990s, El Niño events
occurred more frequently and lasted longer. The longest El Niño of
the 20th century persisted from 1991 to 1995 and was rapidly succeeded by
the most intense El Niño of the 20th century, in 1997-1998 (WMO,
1999).
- Anthropogenic global warming, which may be expected to lead to changes
in all attributes of the climate system. Most obviously, we would expect it
to lead to an increased frequency of high-temperature extremes and a reduction
in days with very low temperatures. There is evidence that the latter trend
already is occurring (Easterling et al., 2000b).
Whatever the cause, it is important to note that a relatively small change
in the mean of a climate variable can lead to a large change in the occurrence
of extremes. Meehl et al. (2000a) explore the implications for extremes of changes
in the mean and/or variance; they show clearly that the relationship between
a change in the mean and a change in the occurrence of extremes is nonlinear,
as illustrated in Figure 8-2.
|