|
13.1.5. Climate Scenarios for the Future
Most of the impact studies evaluated in this chapter have attempted to characterize
the future climate of a study region by using climate change scenarios. General
reviews of the development and application of climate change scenarios are provided
in Chapter 3 and in TAR WGI Chapter
13. It also should be noted that many recent impact studies in Europe have
followed published guidelines concerning the use of scenarios (Carter et al.,
1994; USCSP, 1994; Smith and Hulme, 1998). This review offers a brief summary
first of the types of scenario information provided in European impact assessments
and second of research to improve this information.
13.1.5.1. Scenario Provision
One or more of three broad classes of climate change scenario generally have
been adopted: synthetic scenarios, palaeoclimatic analogs, and scenarios that
are based on outputs from GCMs. The impacts of these scenario changes conventionally
are assessed relative to conditions under a reference or “baseline” climate
that represents present-day conditions (commonly 1961–1990).
|
Box 13-1. Some Key Features of Climate Scenarios for Europe
Temperature
- Annual temperatures over Europe warm at a rate of between 0.1 and
0.4°C per decade. This warming of future annual climate is greatest
over southern Europe (Spain, Italy, Greece) and northeast Europe (Finland,
western Russia) and least along the Atlantic coastline of the continent.
- In winter, the continential interior of eastern Europe and western
Russia warms more rapidly (0.15–0.6°C per decade) than elsewhere. In
summer, the pattern of warming displays a strong south-to-north gradient,
with southern Europe warming at a rate of between 0.2 and 0.6°C per
decade and northern Europe warming between 0.08 and 0.3°C per decade.
- Winters currently classified as cold (occurring 1 year in 10 during
1961–1990) become much rarer by the 2020s and disappear almost entirely
by the 2080s. In contrast, hot summers become much more frequent. Under
the 2080s scenario, nearly every summer is hotter than the 1-in-10 hot
summer as defined under the present climate.
- The agreement between models about these future temperature changes
is greatest over southern Europe in winter. In summer, however, this
region shows the greatest level of disagreement between model simulations.
All model simulations show warming in the future across the whole of
Europe and in all seasons.
Precipitation
- The general pattern of future change in annual precipitation over
Europe is for widespread increases in northern Europe (between +1 and
+2% per decade), smaller decreases across southern Europe (maximum –1%
per decade), and small or ambiguous changes in central Europe (France,
Germany, Hungary, Belarus).
- There is a marked contrast between winter and summer patterns of
precipitation change. Most of Europe gets wetter in the winter season
(between +1 and +4% per decade); the exception is the Balkans and Turkey,
where winters become drier. In summer, there is a strong gradient of
change between northern Europe (wetting of as much as +2% per decade)
and southern Europe (drying of as much as –5% per decade).
- The areas, however, where these changes are greater than the 2-standard
deviation estimate of natural 30-year time scale climate variability
are limited to the later periods (2050s and 2080s) and to the scenarios
with the larger rates of global warming (B2, A1, and A2).
- Only for the A2-high scenario are there substantial areas in Europe
(Fennoscandia and northwest Europe) where precipitation changes by the
2020s are larger than what might occur as a result of natural climate
variability. Even for this scenario with rapid global warming, not all
regions in Europe have well-defined precipitation signals from GHG-induced
climate change by the 2080s.
- The intermodel range of seasonal precipitation changes generally
is larger than the median change, implying that sign differences frequently
exist between the precipitation changes simulated by different climate
models. The largest intermodel differences tend to occur in southern
and northern Europe. Intermodel differences are smallest across much
of central Europe.
Weather Extremes
- The scenarios do not explicitly quantify changes in daily weather
extremes. However, it is very likely that frequencies and intensities
of summer heat waves will increase throughout Europe; likely that intense
precipitation events will increase in frequency, especially in winter,
and that summer drought risk will increase in central and southern Europe;
and possible that gale frequencies will increase.
Sea Level
- Global-mean sea level rises by the 2050s by 13–68 cm. These estimates
make no allowance for natural vertical land movements. Owing to tectonic
adjustments following the last glaciation, there are regional differences
across Europe in the natural rates of relative sea-level change.
|
Synthetic or incremental scenarios describe techniques whereby particular climatic
(or related) elements are changed by a realistic but arbitrary amount, often
according to an interpretation of climate model simulations for a region. They
are simple to use and can offer a useful tool for exploring the sensitivity
of an exposure unit to a plausible range of climatic variations. They commonly
are applied prior to the adoption of more detailed GCM-based scenarios. For
example, national assessments in CEE conducted as part of the U.S. Country Studies
Program adopted adjustments of present-day temperatures by +1, +2, +3, and +4°C
and baseline precipitation by ±5, +10, +15, and +20% (e.g., Smith and Pitts,
1997; Kalvová, 1995; Alexandrov, 1997). Scenarios based on GCM simulations are
the most widely adopted in impact studies reported from Europe. Some of these
studies employ scenarios that are based on equilibrium 2xCO2 model
simulations that were conducted during the 1980s (e.g., Smith et al., 1996;
Tarand and Kallaste, 1998). The performance of some of these GCMs at simulating
current climate over Europe was examined by Smith and Pitts (1997) and Kalvová
and Nemesová (1997). Among the models considered, they found that the Goddard
Institute for Space Studies (GISS) and Canadian Centre for Climate Modeling
and Analysis (CCCM) models best simulated current temperature, whereas the GISS
and UK89 models best simulated precipitation in northern regions and the CCCM
model best simulated precipitation in southern regions.
Scenarios from the earliest transient-response experiments with coupled atmosphere-ocean
GCMs (AOGCMs), which ignored historical greenhouse gas (GHG) forcing, were adopted
in several studies that used direct model outputs (e.g., Harrison et al., 1995b)
or modified the outputs to account for historical forcing, using simple climate
models (e.g., Carter et al., 1996a; UK Department of the Environment, 1996).
Scenarios from transient-response experiments that explicitly account for historical
forcing have been adopted in the most recent impact studies (e.g., Arnell, 1999;
Harrison and Butterfield, 1999; Hulme et al., 1999). Some of these scenarios
also incorporate aerosol effects, ensemble simulations, and multidecadal climatic
variability. Many of these GCM results are lodged with the IPCC Data Distribution
Centre (DDC) and were used in developing the European scenarios of A Concerted
Action Towards A Comprehensive Climate Impacts and Adaptations Assessment for
the European Union (ACACIA).
13.1.5.2. Scenarios for Europe
The climate change scenarios summarized here originally were prepared for the
European ACACIA project and subsequently developed further for the IPCC (Hulme
and Carter, 2000). The method by which they were developed is briefly described
in Chapter 3 of this volume and more fully in Carter et
al. (2000). These scenarios define a range of future European climates that
embrace some of the major uncertainties in future climate prediction. The scenarios
were placed in the context of model estimates of the natural variability of
European climate. The baseline period selected was 1961–1990; changes in mean
30-year climates were calculated for the periods centered on the 2020s (2010–2039),
the 2050s (2040–2069), and the 2080s (2070–2099). Each climate scenario is based
on one of the four preliminary SRES98 marker emissions scenarios from the IPCC
Special Report on Emissions Scenarios (SRES) (Nakicenovic, 2000).
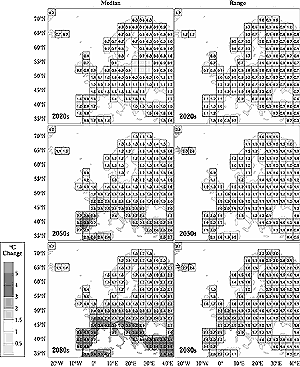
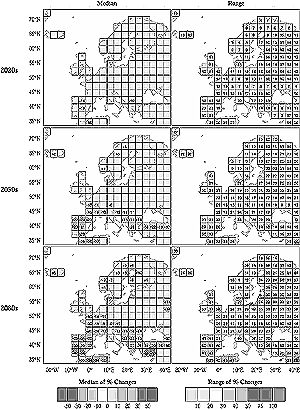
For each scenario, season, variable, and time-slice, two maps were constructed
(see Figures 13-3 and 13-4). One
map shows the median change from the sample of eight standardized and scaled
GCM responses; the other map shows the absolute range of these eight responses.
The idea of signal-to-noise ratios in these regional responses was introduced
by comparing median scaled-GCM changes against an estimate of natural multidecadal
variability derived from the 1,400-year unforced climate simulation made with
the HadCM2 model (Stott and Tett, 1998). In the maps showing median changes,
only values exceeding the 2-standard deviation estimate of natural multidecadal
variability are plotted. Figures 13-3 and 13-4
show an example of this information for the B2-mid scenario for summer temperature
and precipitation. A complete set of illustrations appears in the report of
the European ACACIA project (Hulme and Carter, 2000).

Figure 13-3: ACACIA B2 summer scenario maps (B2-mid, JJA) for
mean temperature. |
|

Figure 13-4: ACACIA B2 summer scenario maps (B2-mid, JJA) for
precipitation. |
|
To condense this scenario information further, national-scale summary graphs
for each European country or groups of countries have been calculated (see Figure
13-5 for an example covering Spain, Sweden, and Poland). Each country graph
shows—for either winter or summer and for either the 2020s, the 2050s, or the
2080s—the distribution of mean changes in mean temperature and precipitation
for each GCM simulation and for each scenario. As with the maps, these changes
are compared with the natural multidecadal variability of temperature and precipitation
extracted from the HadCM2 1,400-year unforced simulation. These graphs provide
a quick assessment at a national scale of the likely range and significance
of future climate change and the extent to which different GCMs agree with regard
to their regional response to a given magnitude of global warming.
A contrasting future climate for Europe—the result of a rapid, nonlinear response
of the climate system—has been suggested. This involves an abrupt collapse of
the thermohaline circulation in the North Atlantic and consequent cooling in
Europe at least for the first half of the 21st century (e.g., Alcamo et al.,
1994). Although this event has not been ruled out on theoretical grounds (see
TAR WGI Chapter 11), it has not
been simulated by any AOGCM (see TAR WGI Chapter
9) and therefore has not been included in this assessment.
|