|
3.5 Manufacturing Industry
3.5.1 Introduction
This section deals with greenhouse gas emissions and greenhouse gas emission
reduction options from the sector manufacturing industry14.
Important are the energy intensive (or heavy) industries, including the production
of metals (especially iron and steel, and aluminium), refineries, pulp and paper,
basic chemicals (important ones are nitrogen fertilizers, petrochemicals, and
chlorine), and non-metallic minerals (especially cement). The less energy intensive
sectors, also called light industry, are among others, the manufacture of food,
beverages, and tobacco; manufacturing of textiles; wood and wood products; printing
and publishing; production of fine chemicals; and the metal processing industry
(including automobiles, appliances, and electronics). In many cases these industries
each produce a wide variety of final products. Non-CO2 gases emitted
from the manufacturing sector include nitrous oxide (N2O), hydrofluorocarbons
(HFCs), perfluorocarbons (PFCs) and sulphur hexafluoride (SF6). Adipic
acid, nitric acid, HCFC-22 and aluminium production processes emit these gases
as unintended by-products. A number of other highly diverse industries, including
a few sectors replacing ozone- depleting substances, use these chemicals in
manufacturing processes15.
All direct emissions from manufacturing are taken into account, plus emissions
in the electricity production sector, as far as they are caused by electricity
consumption by manufacturing industry firms.
Kashiwagi et al. (1996) dealt with industry emission reduction options in IPCC
(1996). In that chapter, processes, energy consumption, and a range of emission
reduction options (mainly for CO2) have been described on a sector-by-sector
basis. For the TAR, these options are summarized (see Section
3.5.3) and estimates of potentials and costs for emission reduction are
quantified. The scope of TAR has been expanded to also include greater detail
on non-CO2 greenhouse gases and the differences in regional emission
profiles and emission reduction opportunities.
3.5.2 Energy and GHG Emissions
|
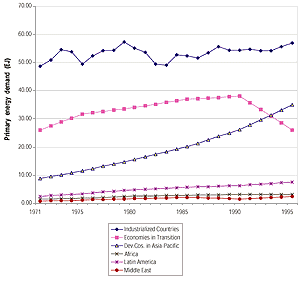
Figure 3.11: Development of industrial energy use in terms of primary
energy (direct fuel use and indirect fuel use in power plants) in the
different world regions. Data from Price et al. (1998, 1999).
|
Emissions of carbon dioxide are still the most dominant contribution of manufacturing
industry to total greenhouse gas emission. These emissions are mainly connected
to the use of energy. In Figure 3.11 an overview is given
of the energy consumption of the manufacturing industry (see also Table
3.1). Energy use is growing in all regions except in the economies in transition,
where energy consumption declined by 30% in the period 1990 to 1995. This effect
is so strong that it nearly offsets growth in all other regions. In industrialized
countries energy use is still growing at a moderate rate; electricity consumption
grows faster than fuel consumption. The strongest growth rates occur in the
developing countries in the Asia-Pacific region. All developing countries together
account for 36% of industrial energy use. However, industry in industrialized
countries on a per capita basis uses about 10 times as much energy as in developing
countries.
The CO2 emissions by the industrial sector worldwide in 1990 amounted
to 1,250MtC. A breakdown of 1990/1995 emissions is given in Table
3.17. However, these emissions are only the direct emissions, related to
industrial fuel consumption. The indirect emissions in 1990, caused by industrial
electricity consumption, are estimated to be approximately 720MtC (Price et al., 1998 and Price et al,. 1999). In the period 1990 to 1995 carbon emissions
related to energy consumption have grown by 0.4% per year.
Note that the energy-related CO2 in a number of sectors are partly
process emissions, e.g., in the refineries and in the production of ammonia,
steel, and aluminium (Kashiwagi et al., 1996). However, the statistics often
do not allow us to make a proper separation of these emissions.
Olivier et al., (1996) also report 91MtC of non-energy use (lubricants, waxes,
etc.) and 167MtC for feedstock use (naphtha, etc.). Further work on investigating
the fact of these carbon streams is necessary; knowledge about emission reduction
options is still in an early stage (Patel and Gielen, 1999; Patel, 1999).
An overview of industrial greenhouse gas emissions is given in Table
3.17. The manufacturing industry turns out to be responsible for about one-third
of emissions of greenhouse gases that are subject to the Kyoto Protocol. Non-CO2
greenhouse gases make up only about 6% of the industrial emissions.
Table 3.17: Overview of greenhouse gas
emissions by manufacturing industry (in MtCeq) in 1990 (1995
for the fluorinated gases). Note that the accuracy is much less than 1 MtCeq
Sources: see notes. |
 |
| Source |
OECD
|
EIT
|
Asia-Pacific DCs
|
Other DCs
|
Total
|
Trends after 1990
(% per year)
|
| |
| Fuel CO2f |
546
|
454
|
461
|
105
|
1567
|
Stable (90-95)
|
| Electricity CO2f |
341
|
167
|
170
|
66
|
726
|
+1.2% (90-95)
|
| CO2 from cementa |
51
|
25
|
60
|
19
|
155
|
|
| CH4a |
|
|
|
|
8
|
|
| N2Ob |
34
|
13
|
13
|
4
|
65
|
|
| HFC-23c |
19
|
~1
|
~2
|
~1
|
22
|
+2% (90-97)
|
| PFCsd |
>11
|
>4
|
>4
|
|
31
|
Decreasing
|
| SF6e |
26
|
6
|
7
|
|
40
|
+4% (90-96)
|
| Total |
|
|
|
|
2614
|
|
| |
| |
Underlying Causes for Emission Trends
|
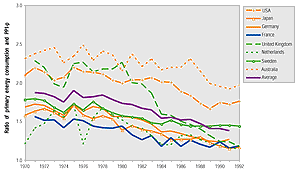
Figure 3.12: Development of the primary energy demand per unit
of production in the pulp and paper industry (PPI-p) in OECD countries.
|
Unander et al. (1999) have analysed the underlying factors for the development
of energy consumption in OECD countries in the period 1990 to 1994. Generally,
the development of energy use can be broken down into three factors: volume,
structure and energy efficiency. In the period examined, development of production
volume differed from country to country, ranging from a 2.0% growth per annum
in Norway to a 1.4% per annum decline in Germany. The second factor is structure:
this is determined by the shares that the various sectors have in the total
industrial production volume. A quite remarkable result is that in nearly all
countries, structural change within the manufacturing industry has an increasing
effect on energy use, i.e. there is a shift towards more energy-intensive industrial
sectors. This is a contrast with earlier periods. Finally, Unander et al. (1999)
found – with some exceptions – a continuing decline in energy intensity
within sectors, be it at a lower pace than in the period 1973 to 1986. For more
results see Table 3.18.
In the paper by Unander et al. (1999), energy intensity is measured in terms
of energy use per unit of value added. An indicator more relevant to the status
of energy efficiency in a country is the specific energy consumption, corrected
for structural differences. Also, such an indicator shows a continuous downward
trend, as can be seen in Figure 3.12. Similar results
were obtained for the iron and steel industry (Worrell et al., 1997a).
A substantial part of industrial greenhouse gas emissions is related to the
production of a number of primary materials. Relevant to this is the concept
of dematerialization (the reduction of society’s material use per unit
of GDP). For most individual materials and many countries dematerialization
can be observed. Cleveland and Ruth (1999) reviewed a range of studies that
show this. They suggest that it cannot be concluded to be due to an overall
decoupling of economy and material inputs, among other reasons because of the
inability to measure aggregate material use. Furthermore, they note that some
analysts observe relinking of economic growth and material use in more recent
years. They warn against “gut” feeling that technical change, substitution,
and a shift to the “information age” inexorably lead to decreased
materials intensity and reduced environmental impact.
Table 3.18: Average annual rates of change in manufacturing
energy use, and the degree to which changes in volume, structure and energy
intensity contribute to such change
Source: Unander et al. (1999) |
|
| Country |
Development in energy use
|
Effect of volume development on energy use
|
Effect of structural change in industry on energy
use
|
Effect of energy intensity changes
within sectors on energy use
|
|
|
1973-1986
|
1986-1990
|
1990-
1994
|
1973-1986
|
1986-1990
|
1990-
1994
|
1973-1986
|
1986-1990
|
1990-1994
|
1973-1986
|
1986-1990
|
1990-1994
|
| |
Australia
Canada
Denmark
Finland
France
Germany
Italy
Japan
Netherlands
Norway
Sweden
UK
USA |
0.3 %
N/A
-1.1 %
1.7 %
-2.3 %
-1.8 %
-1.8 %
-1.8 %
-4.0 %
0.1 %
-1.4 %
-3.6 %
-1.9 %
|
3.3 %
0.7 %
-3.3 %
3.3 %
1.3 %
0.6 %
3.8 %
3.5 %
4.4 %
-0.9 %
0.0 %
0.0 %
2.9 %
|
0.8 %
0.8 %
1.5 %
1.8 %
0.7 %
-0.5 %
-0.7 %
-0.1 %
0.0 %
1.5 %
0.0 %
-2.4 %
1.9 %
|
1.1 %
2.0 %
2.1 %
2.9 %
1.2 %
1.1 %
3.4 %
3.2 %
1.8 %
0.5 %
1.3 %
-0.7 %
2.0 %
|
3.2 %
1.7 %
-0.6 %
3.2 %
3.2 %
2.7 %
4.0 %
6.3 %
2.8 %
-1.3 %
1.5 %
3.9 %
3.0 %
|
1.9 %
1.4 %
0.9 %
1.6 %
-0.5 %
-1.4 %
0.2 %
-0.4 %
0.6 %
2.0 %
1.3 %
-0.2 %
1.8 %
|
0.0 %
N/A
-0.3 %
-0.1 %
-0.2 %
-0.4 %
0.0 %
-2.0 %
1.1 %
0.6 %
-0.4 %
-0.4 %
-1.1 %
|
0.6%
-0.1%
-0.1%
0.3%
0.1%
-0.5%
0.2%
-0.2%
-0.4%
2.2%
0.3%
-0.3%
-0.5%
|
-0.4%
0.4%
0.0%
1.6%
0.0%
1.0%
0.4%
0.1%
0.8%
0.8%
2.8%
-0.5%
0.1%
|
-1.2%
N/A
-2.9%
-2.0%
-3.3%
-2.6%
-5.2%
-3.0%
-6.9%
-1.1%
-2.2%
-2.6%
-2.8%
|
-2.1%
-0.8%
-2.6%
-0.2%
-2.0%
-1.6%
-0.4%
-2.6%
2.0%
-1.8%
-1.9%
-3.6%
0.5%
|
0.1%
-1.0%
0.7%
-1.5%
1.2%
-0.1%
-1.4%
0.2%
-1.5%
-1.3%
-4.1%
-1.6%
1.6%
|
| |
|