3.2 Trends in Energy Use and Associated Greenhouse Gas Emissions
|

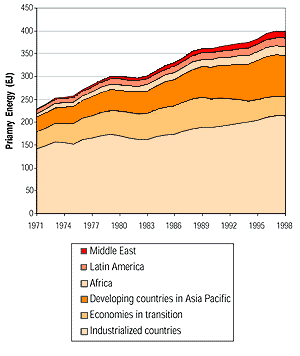
Figure TS.3: World primary energy use by region from 1971 to 1998.
Note: Primary energy calculated using the International Energy Agency's
(IEA) physical energy content method based on the primary energy sources
used to produce heat and electricity.
|
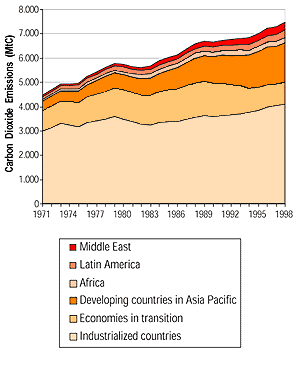
Global consumption of energy and associated emission of CO2 continue
an upward trend in the 1990s (Figures TS.3 and TS.4).
Fossil fuels remain the dominant form of energy utilized in the world, and energy
use accounts for more than two thirds of the GHG emissions addressed by the
Kyoto Protocol. In 1998, 143 exajoules (EJ) of oil, 82EJ of natural gas, and
100EJ of coal were consumed by the world’s economies. Global primary energy
consumption grew an average of 1.3% annually between 1990 and 1998. Average
annual growth rates were 1.6% for developed countries and 2.3% to 5.5% for developing
countries between 1990 and 1998. Primary energy use for the EITs declined at
an annual rate of 4.7% between 1990 and 1998 owing to the loss of heavy industry,
the decline in overall economic activity, and restructuring of the manufacturing
sector.
Average global carbon dioxide emissions grew – approximately at the same
rate as primary energy – at a rate of 1.4% per year between 1990 and 1998,
which is much slower than the 2.1% per year growth seen in the 1970s and 1980s.
This was in large measure because of the reductions from the EITs and structural
changes in the industrial sector of the developed countries. Over the longer
term, global growth in CO2 emissions from energy use was 1.9% per
year between 1971 and 1998. In 1998, developed countries were responsible for
over 50% of energy-related CO2 emissions, which grew at a rate of
1.6% annually from 1990. The EITs accounted for 13% of 1998 emissions, and their
emissions have been declining at an annual rate of 4.6% per year since 1990.
Developing countries in the Asia-Pacific region emitted 22% of the global total
carbon dioxide, and have been the fastest growing with increases of 4.9% per
year since 1990. The rest of the developing countries accounted for slightly
more than 10% of total emissions, growing at an annual rate of 4.3% since 1990.
During the period of intense industrialization from 1860 to 1997, an estimated
13,000EJ of fossil fuel were burned, releasing 290GtC into the atmosphere, which
along with land-use change has raised atmospheric concentrations of CO2
by 30%. By comparison, estimated natural gas resources6
are comparable to those for oil, being approximately 35,000EJ. The coal resource
base is approximately four times as large. Methane clathrates (not counted in
the resource base) are estimated to be approximately 780,000EJ. Estimated fossil
fuel reserves contain 1,500GtC, being more than 5 times the carbon already released,
and if estimated resources are added, there is a total of 5,000GtC remaining
in the ground. The scenarios modelled by the SRES without any specific GHG emission
policies foresee cumulative release ranging from approximately 1,000 GtC to
2,100 GtC from fossil fuel consumption between 2,000 and 2,100. Cumulative carbon
emissions for stabilization profiles of 450 to 750 ppmv over that same period
are between 630 and 1,300GtC (see Figure TS.5).
Fossil-fuel scarcity, at least at the global level, is therefore not a significant
factor in considering climate change mitigation. On the contrary, different
from the relatively large coal and unconventional oil and gas deposits, the
carbon in conventional oil and gas reserves or in conventional oil resources
is much less than the cumulative carbon emissions associated with stabilisation
at 450 ppmv or higher (Figure TS.5). In addition,
there is the potential to contribute large quantities of other GHGs as well.
At the same time it is clear from Figure TS.5 that
the conventional oil and gas reserves are only a small fraction of the total
fossil fuel resource base. These resource data may imply a change in the energy
mix and the introduction of new sources of energy during the 21st century. The
choice of energy mix and associated investment will determine whether, and if
so at what level and cost, greenhouse concentrations can be stabilized. Currently
most such investment is directed towards discovering and developing more conventional
and unconventional fossil resources.
 |
Figure TS.4: World CO2 emissions by region, 1971-1998.
|
|