3.4.3 Historic and Future Trends
|

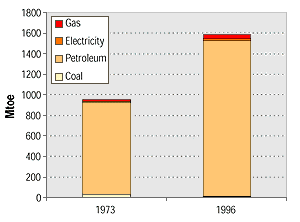
Figure 3.5: World transportation energy use, 1973 and 1996.
|
|

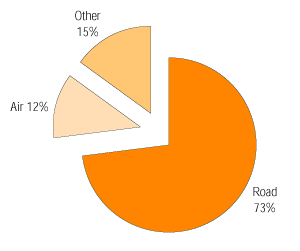
Figure 3.6: World transport energy by mode, 1996.
|
|

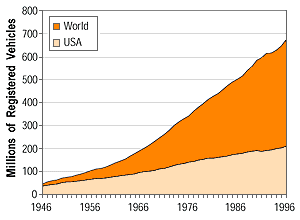
Figure 3.7: Growth of world motor vehicle population, 1946-1996.
|
|

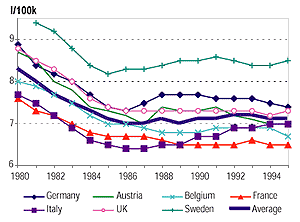
Figure 3.8: Weighted average fuel consumption of new passenger
cars.
|
Since the publication of the SAR, important advances have been achieved in
several areas of automotive technology. Among the most significant are: (1)
two global automotive manufacturers are now selling hybrid automobiles 5-10
years ahead of what was anticipated just 5 years ago; (2) dramatic reductions
have been made in fuel cell cost and size, such that several manufacturers have
announced that they will introduce fuel cell vehicles by 2005, 10-20 years ahead
of what was previously anticipated; and (3) improvements in fuels, engine controls,
and emissions after-treatment led to the production of a gasoline internal combustion
engine vehicle with virtually zero emissions of urban air pollutants. This achievement,
combined with regulations requiring low-sulphur fuels, may foreshadow the development
of acceptable emissions control systems for more energy efficient direct injection
engines, although significant hurdles remain. It may also reduce the incentive
for adopting alternative fuel vehicles, such as battery electric and natural
gas vehicles, which can also have lower greenhouse gas emissions. These developments
could have profound effects on future GHG emissions from road, rail, marine,
and pipeline transport. Also, since the publication of the SAR, the IPCC has
released a comprehensive report on the impacts of aviation on the global atmosphere
(Penner et al., 1999) that includes a projection of expected progress in reducing
energy intensity and GHG emissions from commercial air transport, and adds greatly
to the information about aviation’s effects on climate.
Worldwide, transport produces roughly 20% of carbon emissions and smaller shares
of the other five greenhouse gasses covered under the Kyoto Protocol. According
to IEA statistics, the transport sector’s share of world GHG emissions
increased from about 19% in 1971 to 22% in 1995 (Price et al., 1998) and 23%
in 1997 (IEA, 1999c, p. II.67). Excluding emissions from vehicle air conditioners
(described in the Appendix), CO2 from combustion of fossil fuels is the predominant
GHG produced by transport, accounting for over 95% of the annual global warming
potential produced by the sector. Nitrous oxide produced by vehicles equipped
with catalytic converters, and methane emitted by internal combustion engines
account for nearly all the remainder. Almost all of the carbon comes from petroleum
fuels. Between 1973 and 1996, world transportation energy use, of which petroleum-derived
fuels comprise over 95%, increased by 66% (Figure 3.5). Alternative energy sources
have not played a significant role in the world’s transport systems. Despite
two decades of price upheavals in world oil markets, considerable research and
development of alternative fuel technologies, and notable attempts to promote
alternative fuels through tax subsidies and other policies, petroleum’s
share of transport energy use has not decreased (94.7% in 1973 and 96.0% in
1996) according to IEA statistics (IEA, 1999c).
On a modal basis, road transport accounts for almost 80% of transport energy
use (Figure 3.6). Light-duty vehicles alone comprise about 50%. Air transport
is the second largest, and most rapidly growing mode, with about 12% of current
transport energy use according to International Energy Agency estimates (IEA,
1999c).
The growth of transport energy use, its continued reliance on petroleum and
the consequent increases in carbon emissions are driven by the long-term trends
of increasing motorization of world transport systems and ever-growing demand
for mobility. Immediately after World War II, the world’s motor vehicle
fleet numbered 46 million vehicles, and 75% of the world’s cars and trucks
were in the USA. In 1996, there were 671 million highway vehicles worldwide,
and the US share stood at just over 30% (Figure 3.7). Since 1970, the US motor
vehicle population has been growing at an average rate of 2.5% per year, but
the population of vehicles in the rest of the world has been increasing almost
twice as rapidly at 4.8% per year (AAMA, 1998, p. 8). The same patterns of growth
are discernible in statistics on vehicle stocks (ECMT, 1998).
Transport achieved major energy efficiency gains in the 1970s and 1980s, partly
because of an economic response to the oil price increases of 1973 to 1974 and
1979 to 1980, and partly as a result of government policies inspired by the
oil price shocks. Driven principally by mandatory standards, the average fuel
economy of new passenger cars doubled in the USA between 1974 and 1984 (e.g.,
Greene, 1998). In Europe, similar improvements were achieved by a combination
of voluntary efficiency agreements and higher taxes on motor fuels. From 1980
to 1995 the average sales-weighted fuel consumption rates of passenger cars
sold in Europe and Japan fell by 12%, from 8.3 l/100km to 7.3 l/100km (Perkins,
1998). All of the decrease, however, occurred between 1980 and 1985 (Figure
3.8). Since 1985, the fuel economies of light-duty vehicles sold in the USA
and Europe have remained essentially constant.
Energy efficiency improvements in other modes have also slowed or stagnated
over the past 10-15 years. Average energy use per passenger-kilometre in Europe
and Japan actually increased between 1973 and 1993/4, but declined by almost
20% in the USA (Table 3.6). Bus and rail modal energy intensities generally
increased, with the exception of rail travel in Europe. The energy intensity
of commercial air travel, however, has declined consistently, achieving a 40%-50%
reduction over the last 25 years.
On the freight side, trucking’s share of tonne km increased in every OECD
country, included in a recent analysis of energy trends by the IEA (1997d, Figure
4.6), leading to an overall increase in the energy intensity (MJ/t-km) of freight
movements. Unlike passenger modes, for freight, changes in modal structure tend
to dominate changes in modal energy intensities in determining overall energy
intensity (IEA, 1997d, p. 127).
The slowing of energy efficiency improvements in recent years has occurred
despite the fact that new technologies with the potential to increase energy
efficiency continue to be adopted. In Europe, the market share of diesel cars
increased from 7% in 1980 to 17% in 1985 and 23% in 1995, due in part to lower
diesel fuel taxes (Perkins, 1998). In the USA, emissions and fuel economy standards
increased the use of multipoint fuel injection from 16% of new light-duty vehicles
in 1985 to 100% in 1999, and installation of 4- and 5-valve engines increased
from zero to 40% over the same period (Heavenrich and Hellman, 1999, Table 4).
Manufacturers also continued to substitute lighter weight materials such as
high-strength steel and aluminium, and to reduce aerodynamic drag and tyre rolling
resistance. Yet fuel economy stagnated because vehicles were made larger and
much more powerful. Between 1988 and 1999, the average mass of a new US light-duty
vehicle increased from 1381 kg to 1534 kg. At the same time, power per kg increased
29% (Heavenrich and Hellman, 1999). In Europe, the average power per car increased
by 27% between 1980 and 1995, from 51 to 65 kW (Perkins, 1998).
Table 3.6: Modal energy intensities,
1973 to 1994
(IEA, 1997d, Table 3.1). |
 |
Energy intensity
MJ per pass-km |
Europe-8
1973
|
Europe-8
1993
|
USA
1973
|
USA
1994
|
Japan
1973
|
Japan
1994
|
 |
| Average, all modes |
1.46
|
1.56
|
3.10
|
2.52
|
1.22
|
1.67
|
| Car |
1.65
|
1.73
|
3.10
|
2.59
|
2.20
|
2.46
|
| Bus |
0.58
|
0.71
|
0.79
|
1.03
|
0.54
|
0.73
|
| Rail |
0.58
|
0.48
|
1.81
|
2.15
|
0.17
|
0.19
|
| Air |
4.55
|
2.78
|
4.92
|
2.46
|
3.49
|
2.13
|
 |
Because of the slowing down of energy efficiency gains, world transportation
energy use is now increasing at just slightly less than the rate of growth in
transportation activity. Given the relatively close correlation between economic
growth and the demand for transport (Table 3.7; see WEC, 1995b, Ch. 3.2 for
further details), it is reasonable to expect continued strong growth of transport
energy use and carbon emissions, unless significant, new policy initiatives
are undertaken. The following paragraphs review several studies of future transportation
demand and energy use. A common theme of these and many others is strong growth
in transport energy use and the challenges it poses to reducing greenhouse gas
emissions from the sector.
Table 3.7: Annual growth in GDP and
transport in OECD countries, 1975-1990
(WEC, 1995b, Table 3.2.1). |
 |
| |
GDP
|
Freight traffic
|
Passenger traffic
|
 |
| OECD Europe |
2.6%
|
2.8%
|
2.8%
|
| USA |
2.8%
|
2.6%
|
2.3%
|
| Japan |
4.2%
|
3.6%
|
2.6%
|
 |
Projections of future transport energy use under baseline assumptions reflect
an expectation of robust growth in transport activity, energy demand, and carbon
emissions through 2020. The World Energy Council (WEC, 1995b) considered three
alternative scenarios for transport energy demand through 2020: (1) “markets
rule”, (2) “muddling through”, and (3) “green drivers”.
Of these, markets rule reflects a high-growth baseline future (2.8%/yr in the
OECD, 5.2% in the rest of the world), muddling through a lower growth one (2.2%/year
in OECD, 4.2% elsewhere). In the markets rule scenario, world transport energy
consumption grows 200% in the quarter century from 1995 to 2020. In the muddling
through scenario, transport energy use grows by 100% by 2020, with most of the
shortfall from the markets rule scenario occurring after 2010. In the green
drivers scenario, transport energy use is nearly constant as a result of much
higher energy taxes and comprehensive environmental regulation. In all three
scenarios, growth in freight transport and air travel far outpace the growth
of passenger vehicle travel, so that the passenger car’s share of total
transport energy use falls from about 50% in 1995 to 30% by 2020.
A more recent WEC (1998a) report foresaw considerably slower growth in transport
energy use through 2020: 55% in a base case with an 85% increase in a higher
economic growth case. In both cases, light-duty vehicles continued to dominate
through 2020, accounting for 44% of global transport energy demand in the base
case. Still road freight and air travel gained on highway passenger vehicles.
Road freight increased from 30% of transport energy demand in 1995 to 33% in
2020. Air transport’s share grew from 8% to almost 13%. Global carbon emissions
from transport were expected to grow by 56% in the base case, from 1.6GtC in
1995 to 2.5GtC in 2020.
The US DOE and US Energy Information Administration’s (EIA’s) International
Energy Outlook (1999b, p.115) foresees transportation’s share of world
oil consumption climbing from 48% in 1996 to 53% by 2010 and 56% by 2020. The
EIA expects a 77% increase in total world transport energy use by 2020, an average
annual global growth rate of 2.4% (Table 3.8). Road dominance
of energy use is maintained by the rapid increase in vehicle stocks outside
of the OECD. The world motor vehicle population is projected to surpass 1.1
billion vehicles in 2020. The SAR (Michaelis et al., 1996, Table 21-3) presented
projections of future global vehicle stocks ranging from 1.2 to 1.6 billion
by 2030, rising to 1.6 to 5.0 billion by 2100.
Table 3.8: Energy information administration
projections of global transport energy use to 2020
(US DOE/EIA, 1999b, Tables E1, E7, E8, E9). |
 |
| |
1996
|
2010
|
2020
|
Average annual percent change
|
| |
Millions of barrels per day
|
 |
| Road |
25.5
|
37.4
|
45.2
|
2.4
|
| Air |
4.0
|
6.6
|
9.6
|
3.7
|
| Other |
5.1
|
5.8
|
6.5
|
1.0
|
| TOTAL |
34.6
|
49.9
|
61.3
|
2.4
|
 |
Projections of passenger travel, energy use, and CO2 emissions to 2050 by Schafer
and Victor (1999) show carbon emissions rising from 0.8GtC in 1990 to 2.7GtC
in 2050, driven by an increase in travel demand from 23 trillion passenger-kilometres
in 1990 to 105 trillion p-km in 2050. The model used is based on constant travel
budgets for time and money, so that as incomes and travel demand grow, passenger
travel must shift to faster modes in order to stay within time budget limits.
As a result, automobile travel first increases, and then eventually declines
as travel shifts to high-speed rail and air. The projections assume that car,
bus and conventional rail systems maintain their energy intensities at approximately
1990 levels through 2050. Energy intensity of the air mode (which by the authors’
definition includes high-speed rail) is assumed to decrease by 70% by 2050,
substantially more than the Penner et al. (1999)-report estimates. No change
in the average carbon content of transportation fuels is assumed.
Projections such as these suggest that it will be very difficult to attain
a goal such as holding transport’s carbon emissions below 1990 levels by
2010. Lead times for introducing significant new technologies, combined with
the normal lifetimes for transportation equipment on the order of 15 years,
imply that sudden, massive changes in the trends and outlooks described above
can be achieved only with determined effort. At the same time, dramatic advances
in transport energy technology have been achieved over just the past 5 years,
and the potential for further advances is very promising. By 2020 and beyond
the world may see revolutionary changes in energy sources and power plants for
new transport equipment, provided that appropriate policies are implemented
to accelerate and direct technological changes towards global environmental
goals.
|