4.1 Introduction
An ecosystem can be practically defined as a dynamic complex of plant, animal and micro-organism communities, and the non-living environment, interacting as a functional unit (Millennium Ecosystem Assessment, Reid et al., 2005). Ecosystems may be usefully identified through having strong interactions between components within their boundaries and weak interactions across boundaries (Reid et al., 2005, part 2). Ecosystems are well recognised as critical in supporting human well-being (Reid et al., 2005), and the importance of their preservation under anthropogenic climate change is explicitly highlighted in Article 2 (The Objective) of the United Nations Framework Convention on Climate Change (UNFCCC).
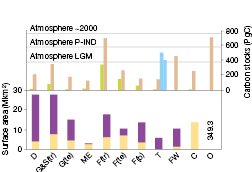
In this chapter the focus is on the properties, goods and services of non-intensively managed and unmanaged ecosystems and their components (as grouped by widely accepted functional and structural classifications, Figure 4.1), and their potential vulnerability to climate change as based on scenarios mainly from IPCC (see Chapter 2 and IPCC, 2007). Certain ecosystem goods and services are treated in detail in other sectoral chapters (this volume): chapters 3 (water), 5 (food, fibre, fisheries), 6 (coasts) and 8 (health). Key findings from this chapter are further developed in the synthesis chapters 17 to 20 (this volume). Region-specific aspects of ecosystems are discussed in chapters 9 to 16 (this volume). This chapter is based on work published since the Third Assessment Report of the IPCC (TAR) (Gitay et al., 2001). We do not summarise TAR findings here, but refer back to relevant TAR results, where appropriate, to indicate confirmation or revision of major findings.

Figure 4.1. Major ecosystems addressed in this report, with their global areal extent (lower panel, Mkm2), transformed by land use in yellow, untransformed in purple, from Hassan et al. (2005), except for mediterranean-climate ecosystems, where transformation impact is from Myers et al. (2000), and total carbon stores (upper panel, PgC) in plant biomass (green), soil (brown), yedoma/permafrost (light blue). D = deserts, G&S(tr) = tropical grasslands and savannas, G(te) = temperate grasslands, ME = mediterranean ecosystems, F(tr) = tropical forests, F(te) = temperate forests, F(b) = boreal forests, T = tundra, FW = freshwater lakes and wetlands, C = croplands, O = oceans. Data are from Sabine et al. (2004, Table 2.2, p. 23), except for carbon content of yedoma permafrost and permafrost (light blue columns, left and right, respectively, Zimov et al., 2006), ocean organic carbon content (dissolved plus particulate organic; Denman et al., 2007, Section 7.3.4.1), and ocean surface area from Hassan et al. (2005, Summary, Table C2, p. 15, inserted as a number). Figures here update the TAR (Prentice et al., 2001), especially through considering soil C to 3 m depth (Jobbagy and Jackson, 2000), as opposed to 1 m. Approximate carbon content of the atmosphere (PgC) is indicated by the dotted lines for last glacial maximum (LGM), pre-industrial (P-IND) and current (about 2000).
Projecting the impacts of climate change on ecosystems is complicated by an uneven understanding of the interlinked temporal and spatial scales of ecosystem responses. Processes at large spatial scales, i.e., the biosphere at the global scale, are generally characterised by slow response times on the order of centuries, and even up to millennia (Jansen et al., 2007). However, it is also important to note that some large-scale responses in the palaeorecord (Jansen et al., 2007) and to current climate anomalies such as El Niño events may emerge at much shorter time-scales (Holmgren et al., 2001; Sarmiento and Gruber, 2002; Stenseth et al., 2002; van der Werf et al., 2004). At continental scales, biomes (see Glossary) respond at decadal to millennial time-scales (e.g., Davis, 1989; Prentice et al., 1991; Lischke et al., 2002; Neilson et al., 2005), and groups of organisms forming ecological communities at the regional scale have shorter response times of years to centuries. Responses of populations (i.e., interbreeding individuals of the same species) occur at intermediate temporal scales of months to centuries, and underpin changes in biodiversity. These include changes at the genetic level that may be adaptive, as demonstrated for example for trees (Jump et al., 2006) and corals (Coles and Brown, 2003). Fast physiological response times (i.e., seconds, hours, days, months) of micro-organisms, plants and animals operate at small scales from a leaf or organ to the cellular level; they underlie organism responses to environmental conditions, and are assessed here if they scale up to have a significant impact at broader spatial scales, or where the mechanistic understanding assists in assessing key thresholds in higher level responses.
The spatial distribution of ecosystems at biome scale has traditionally been explained only in terms of climate control (Schimper, 1903), but it is increasingly apparent that disturbance regimes such as fire or insects may strongly influence vegetation structure somewhat independently of climate (e.g., Andrew and Hughes, 2005; Bond et al., 2005). Biomes are differentially sensitive to climatic change (e.g., Kirschbaum and Fischlin, 1996; Sala et al., 2000; Gitay et al., 2001), with temperature-limited biomes prone to impacts of warming, and water-limited biomes prone to increasing levels of drought. Some, such as fire-dependent biomes, may be in a meta-stable state that can change rapidly under climate and other environmental changes (Scheffer et al., 2001; Sankaran et al., 2005). Marine biome responses, too, have been shown at decadal scales (Beaugrand et al., 2002), with more rapid regime shifts within decades (Edwards et al., 2002; Richardson and Schoeman, 2004; Edwards et al., 2006). Biomes therefore provide a useful level of ecological organisation at which to summarise climate change impacts, being of large enough extent to conduct a global synthesis, yet having a response time relevant to anthropogenic climate change.