5.4.2.2 Review of crop impacts versus incremental temperature change
The increasing number of regional and global simulation studies performed since the TAR make it possible to produce synthesis graphs, showing not only changes in yield for key crops against temperature (a proxy for both time and severity of climate change), but also other important climate and management factors, such as changes in precipitation or adaptation strategies. An important limitation of these syntheses is that they collect single snapshots of future impacts, thereby lacking the temporal and causal dynamics that characterise actual responses in farmers’ fields. Yet they are useful to summarise many independent studies.
Figure 5.2 provides an example of such analyses for temperature increases ranging from about 1-2ºC, typical of the next several decades, up to the 4-5°C projected for 2080 and beyond. The results of such simulations are generally highly uncertain due to many factors, including large discrepancies in GCM predictions of regional precipitation change, poor representation of impacts of extreme events and the assumed strength of CO2 fertilisation (5.4.1). Nevertheless, these summaries indicate that in mid- to high-latitude regions, moderate to medium local increases in temperature (1ºC to 3ºC), across a range of CO2 concentrations and rainfall changes, can have small beneficial impacts on the main cereal crops. Further warming has increasingly negative impacts (medium to low confidence) (Figure 5.2a, c, e). In low-latitude regions, these simulations indicate that even moderate temperature increases are likely to have negative yield impacts for major cereal crops (Figure 5.2b, d, f). For temperature increases more than 3°C, average impacts are stressful to all crops assessed and to all regions (medium to low confidence) (Figure 5.2). The low and mid-to-high latitude regions encompass the majority of global cereal production area. This suggests that global production potential, defined by Sivakumar and Valentin (1997) as equivalent to crop yield or Net Primary Productivity (NPP), is threatened at +1°C local temperature change and can accommodate no more that +3°C before beginning to decline. The studies summarised in Figure 5.2 also indicate that precipitation changes (and associated changes in precipitation:evaporation ratios), as well as CO2 concentration, may critically shape crop-yield responses, over and above the temperature signal, in agreement with previous analyses (Section 5.4.1). The effects of adaptation shown in Figure 5.2 are considered in Section 5.5.
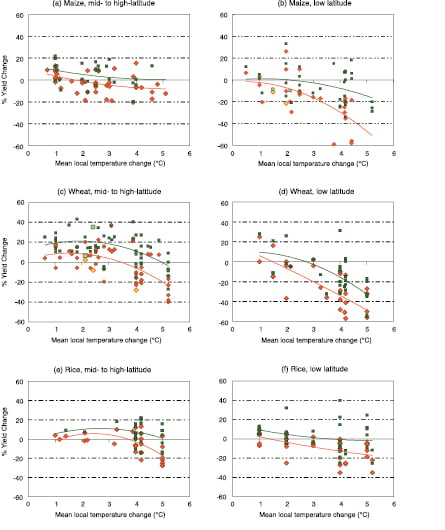
Figure 5.2. Sensitivity of cereal yield to climate change for maize, wheat and rice, as derived from the results of 69 published studies at multiple simulation sites, against mean local temperature change used as a proxy to indicate magnitude of climate change in each study. Responses include cases without adaptation (red dots) and with adaptation (dark green dots). Adaptations+ represented in these studies include changes in planting, changes in cultivar, and shifts from rain-fed to irrigated conditions. Lines are best-fit polynomials and are used here as a way to summarise results across studies rather than as a predictive tool. The studies span a range of precipitation changes and CO2 concentrations, and vary in how they represent future changes in climate variability. For instance, lighter-coloured dots in (b) and (c) represent responses of rain-fed crops under climate scenarios with decreased precipitation. Data sources: Bachelet and Gay, 1993; Rosenzweig and Parry, 1994; El-Shaer et al., 1997; Iglesias and Minguez, 1997; Kapetanaki and Rosenzweig, 1997; Matthews et al., 1997; Lal et al., 1998; Moya et al., 1998; Winters et al., 1998; Yates and Strzepek, 1998; Brown and Rosenberg, 1999; Evenson, 1999; Hulme et al., 1999; Parry et al., 1999; Iglesias et al., 2000; Saarikko, 2000; Tubiello et al., 2000; Bachelet et al., 2001; Easterling et al., 2001; Kumar and Parikh, 2001; Aggarwal and Mall, 2002; Alig et al., 2002; Arnell et al., 2002; Chang, 2002; Corobov, 2002; Cuculeanu et al., 2002; Mall and Aggarwal, 2002; Olesen and Bindi, 2002; Parry and Livermore, 2002; Southworth et al., 2002;
Tol, 2002; Tubiello and Ewert, 2002; Aggarwal, 2003; Carbone et al., 2003; Chipanshi et al., 2003; Izaurralde et al., 2003; Jones and Thornton, 2003; Luo et al., 2003; Matthews and Wassmann, 2003; Reilly et al., 2003; Rosenberg et al., 2003; Tan and Shibasaki, 2003; Droogers, 2004; Faisal and Parveen, 2004; Adejuwon, 2005; Branco et al., 2005; Butt et al., 2005; Erda et al., 2005; Ewert et al., 2005; Fischer et al., 2005b; Gbetibouo and Hassan, 2005; Gregory et al., 2005; Haque and Burton, 2005; Maracchi et al., 2005; Motha and Baier, 2005; Palmer et al., 2005; Parry et al., 2005; Porter and Semenov, 2005; Sands and Edmonds, 2005; Schröter et al., 2005; Sivakumar et al., 2005; Slingo et al., 2005; Stigter et al., 2005;
Thomson et al., 2005a, 2005b; Xiao et al., 2005; Zhang and Liu, 2005; Zhao et al., 2005; Aggarwal et al., 2006.