| 9.4. Long-Term Emissions Scenarios
Long-term projections to the year 2050 producing 3-D emissions data have been
made by the Forecasting and Economic Analysis Subgroup of CAEP, using the NASA
studies as a base (CAEP/4-FESG, 1998), and by DTI using the ANCAT studies as
a base (Newton and Falk, 1997). Long-term projections of total demand, fuel
consumption, and emissions (but not providing 3-D data) have also been made
by EDF (Vedantham and Oppenheimer, 1994, 1998), WWF (Barrett, 1994), and MIT
(Schafer and Victor, 1997).
Table 9-9: Summary of IPCC GDP scenarios used in FESG model.
|
| |
Average Annual Global GDP Growth |
| Rate Scenario |
1990-2025 |
1990-2100 |
| IS92a |
2.9% |
2.3% |
|
Predictions of traffic demand and resulting emissions beyond 2015 become increasingly
uncertain because the probability for unforeseeable major changes in key factors
influencing the results steadily increases. The best approach for insight into
the evolution of long-term futures is the application of scenarios. A scenario
is simply a set of assumptions devised to reflect the possible development of
a particular situation over time. These assumptions are used as inputs to a
model that describes the manner in which an activity might develop over time.
A range of possible futures can be described by a set of independent scenarios.
The results of the scenario are difficult to judge in terms of confidence level:
They are simply the outcome of input assumptions. However, scenarios can be
objectively judged as implausible by showing that their assumptions or outcomes
conflict with industry trends or with invariant rules and laws that might reasonably
be expected to remain unchanged during the scenario time period or by revealing
internal inconsistencies or incompatibilities with other dominating external
developments. Investigation of the consequences and implications of scenarios
can be used to support a subjective assessment regarding which of the remaining
possible scenarios might be more plausible than others.
Table 9-10: Traffic projections and 5-year average growth rates
from FESG (CAEP/4 - FESG Report 4, 1998).
|
|
Fa |
Fa |
Fc |
Fc |
Fe |
Fe
|
| |
Demand |
Growth Rate |
Demand |
Growth Rate |
Demand |
Growth Rate
|
| Year |
(109
RPK) |
(%) |
(109
RPK) |
(%) |
(109
RPK) |
(%)
|
| 1995 |
2,536.6a
|
|
2,536.6a
|
|
2,536.6a
|
| 2000 |
3,238.0
|
5.0
|
3,068.8
|
3.9
|
3,336.1
|
5.6
|
| 2005 |
3,981.4
|
4.2
|
3,591.9
|
3.2
|
4,322.4
|
5.3
|
| 2010 |
4,782.6
|
3.7
|
4,103.0
|
2.7
|
5,491.7
|
4.9
|
| 2015 |
5,638.6
|
3.3
|
4,596.1
|
2.3
|
6,876.2
|
4.6
|
| 2020 |
6,552.9
|
3.1
|
5,070.7
|
2.0
|
8,302.4
|
3.8
|
| 2025 |
7,533.6
|
2.8
|
5,530.7
|
1.8
|
9,908.5
|
3.6
|
| 2030 |
8,592.7
|
2.7
|
5,981.4
|
1.6
|
11,727.0
|
3.4
|
| 2035 |
9,744.9
|
2.5
|
6,429.8
|
1.5
|
13,794.9
|
3.3
|
| 2040 |
11,006.8
|
2.5
|
6,881.5
|
1.4
|
16,155.8
|
3.2
|
| 2045 |
12,396.5
|
2.4
|
7,342.5
|
1.3
|
18,864.2
|
3.1
|
| 2050 |
13,933.5
|
2.4
|
7,817.2
|
1.3
|
21,978.2
|
3.1
|
|
|

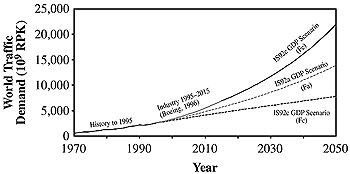
Figure 9-16: ICAO/FESG traffic demand scenarios to
2050 (based on IPCC IS92a, IS92c, and IS92e).

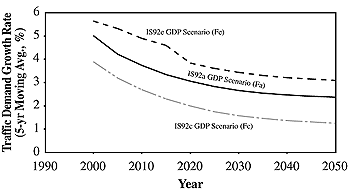
Figure 9-17: Average traffic growth rates from FESG

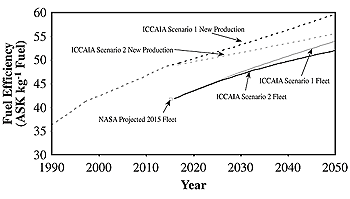
Figure 9-18: Fuel efficiency trends to 2050
corresponding to the two ICCAIA technology scenarios
for the FESG high traffic demand case.

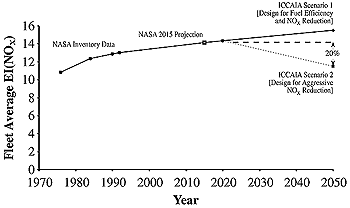
Figure 9-19: Fleet average trends in EI(NOx) showing
projections for the two ICCAIA technology scenarios.
|
9.4.1. FESG 2050 Scenarios
9.4.1.1. Development of Traffic Projection Model
In developing long-term traffic scenarios, various models of traffic demand
were considered (CAEP/4-FESG, 1998), particularly those incorporating a market
maturity concept. Under this concept, historical traffic growth rates in excess
of economic growth are considered unlikely to continue indefinitely, and traffic
growth will eventually approach a rate equal to GDP growth as the various global
markets approached maturity. Based on this assumption, a single global model
of traffic demand per unit of GDP was developed, based on a logistics growth
curve function:
t = time
RPK = revenue passenger-km
GDP = gross domestic product
The parameters in the model equation were estimated from historic values of
RPK/GDP for the period 1960 through 1995. No constraints were imposed on the
values the parameters could take. Further details of the modeling process appear
in CAEP/4-FESG (1998). Table 9-9 lists the GDP growth
assumptions used in developing these scenarios (Leggett et al., 1992). The key
assumptions of this approach follow:
- The world can be treated as a single, gradually maturing aviation market
that is the sum of regional markets at various stages of maturity.
- Historical values of world demand and GDP over time provide sufficient information
about the stage of development of the industry to provide reliable estimates
of market maturity.
- Business and personal travel sectors can be combined.
- Global traffic growth is driven primarily by global GDP; as markets mature,
overall passenger growth rates will eventually grow in line with GDP growth.
- Fuel will be available, and fuel prices will not increase greatly relative
to other costs.
- Whatever aviation technological or regulatory changes occur, they will have
no significant impact on ticket prices, demand, or service availability.
- Infrastructure will be sufficient to handle demand.
- There will be no significant impacts from other travel modes (e.g., high-speed
rail) or alternative technologies (e.g., telecommunications).
Perhaps the most critical assumption of this methodology was that historical
global traffic totals contained sufficient information about the maturity of
the industry as a whole to provide a reasonable basis upon which long-term aviation
trends could be projected. There is a question of whether the signals of recent
years (i.e., that overall traffic growth is slowing) are sufficiently robust
to provide a reliable indication of future long-term growth. A related concern
is that historical world traffic totals are dominated by OECD experience, thus
may not adequately capture the potential for growth in other, less-developed
regions (CAEP/4-FESG, 1998). To a large extent, the FESG scenarios for 2050
reflect assumptions of no fundamental change in overall revenue/cost structure
trends of the aviation industry and no fundamental changes in the trends in
technology or society. They also assume that the growth of air traffic demand
will not be significantly constrained by other limiting factors. Sections 9.6.5
and 9.6.6 examine the availability of infrastructure
and fuel with regard to the plausibility of all of the long-term scenario projections.
Growth rates from the model were applied to 1995 reported world traffic demand
(Boeing, 1996)-together with GDP growth rates from the IPCC IS92a, IS92e, and
IS92c scenarios-to produce FESG base case (Fa), high (Fe), and low (Fc) scenarios
of scheduled traffic demand. The high case (Fe) was adjusted slightly to match
the NASA traffic forecast for 2015 on which the NASA 2015 emission inventory
was based. The basis for the NASA 2015 traffic forecasts were GDP forecasts
that were similar to the IS92e GDP scenario (Boeing, 1996). The resulting traffic
demand and average growth rate for the three 2050 scenarios are illustrated
in Figures 9-16 and 9-17
and listed in Table 9-10. The traffic demand scenarios
have been labeled Fa through Fe for brevity; these labels, when combined with
the appropriate technology assumption designator (1 or 2; see Section
9.4.1.2), form the complete designator for the FESG scenarios used throughout
the rest of this report.
Global traffic from the model projections was apportioned over 45 regional
traffic flows with a separate market share model because certain regions grow
faster than others, and the correct distribution of traffic is important in
the calculation of the effects of emissions on the atmosphere. In this procedure,
regional traffic flows were expressed as a share of the global market; using
the market share and historical growth patterns ensures consistency between
regional flows and the global forecast. The underlying assumption of this procedure
is that each regional share approaches its ultimate share of the total market
asymptotically. Mature markets tend to have declining shares approaching an
asymptotic value, whereas developing markets tend to increase their shares.
Adjustments of traffic flows were made so that the "top-down" traffic projections
of the FESG global model were matched by a reasonable "bottom-up" distribution
of regional traffic flows. These traffic flows include all traffic in all regions,
and regional variations in growth rates are highlighted. Factors that affect
the operations of military and general aviation aircraft were also estimated,
and projections were made of the growth of these sectors (CAEP/4-FESG, 1998).
Table 9-11: ICCAIA NOx and fuel-efficiency technology assumptions
for 2050.
|
| Technology Scenario |
Fuel Efficiency Increase by 2050 |
LTO NOx Levels |
| Design for fuel efficiency and NOx reduction |
Average of production aircraft will be 40-50% better relative to 1997
levels |
Fleet average will be 10-30% below CAEP/2 limit by 2050; fleet average
EI(NOx) = 15.5 in 2050 |
| Design for aggressive NOx reduction |
Average of production aircraft will be 30-40% better relative to 1997
levels |
Average of production aircraft will be 30-50% below CAEP/2 limit by 2020
and 50-70% below CAEP/2 limit by 2050; fleet average |
|
Table 9-12: Projected scheduled fleet fuel efficiency (Sutkus,
1997).
|
| |
Scheduled Fleet Fuel
Efficiency (ASK kg-1 Fuel)
|
| 2015 NASA Inventory |
41.8
|
| Traffic Scenario |
Technology
Scenario 1 |
Technology
Scenario 2 |
| Demand scenario Fa |
53.6 |
51.8 |
| Demand scenario Fc |
53.1 |
51.4 |
| Demand scenario Fe |
54.0 |
52.0 |
|
Table 9-13: Results of FESG year 2050 scenarios calculations.
|
| Sector |
Fa1 |
Fa2 |
Fc1 |
Fc2 |
Fe1 |
Fe2 |
| Calculated Fuel Burned (Tg) |
| Scheduled |
396.1
|
410.8
|
224.0
|
232.3
|
620.0
|
643.9
|
| Charter |
21.4
|
22.2
|
12.1
|
12.6
|
33.5
|
34.8
|
| FSU/China |
30.3
|
31.4
|
8.8
|
9.1
|
67.5
|
70.1
|
| General Aviation |
8.8
|
8.8
|
8.8
|
8.8
|
8.8
|
8.8
|
| Civil Subtotal |
456.6
|
473.2
|
253.8
|
262.8
|
729.8
|
757.7
|
| Military |
14.4
|
14.4
|
14.4
|
14.4
|
14.4
|
14.4
|
| Global Total |
471.0
|
487.6
|
268.2
|
277.2
|
744.3
|
772.1
|
Calculated CO2 Emissions (Tg C)
|
| Scheduled |
340.7
|
353.3
|
192.7
|
199.7
|
533.2
|
553.7
|
| Charter |
18.4
|
19.1
|
10.4
|
10.8
|
28.8
|
29.9
|
| FSU/China |
26.0
|
27.0
|
7.5
|
7.8
|
58.1
|
60.3
|
| General Aviation |
7.6
|
7.6
|
7.6
|
7.6
|
7.6
|
7.6
|
| Civil Subtotal |
392.7
|
407.0
|
218.2
|
226.0
|
627.7
|
651.6
|
| Military |
12.4
|
12.4
|
12.4
|
12.4
|
12.4
|
12.4
|
| Global Total |
405.1
|
419.4
|
230.6
|
238.4
|
640.1
|
664.0
|
Calculated NOx Emissions (Tg as
NO2)
|
| Scheduled |
6.1
|
4.7
|
3.5
|
2.7
|
9.6
|
7.4
|
| Charter |
0.4
|
0.3
|
0.2
|
0.2
|
0.6
|
0.4
|
| FSU/China |
0.5
|
0.3
|
0.1
|
0.1
|
1.0
|
0.8
|
| General Aviation |
0.1
|
0.1
|
0.1
|
0.1
|
0.1
|
0.1
|
| Civil Subtotal |
7.0
|
5.4
|
3.9
|
3.0
|
11.3
|
8.7
|
| Military |
0.1
|
0.1
|
0.1
|
0.1
|
0.1
|
0.1
|
| Global Total |
7.2
|
5.5
|
4.0
|
3.1
|
11.4
|
8.8
|
Calculated Fleet Average EI(NOx)
[g NOx (as NO2)
kg-1 fuel burned]
|
| Scheduled |
15.5
|
11.5
|
15.5
|
11.5
|
15.5
|
11.5
|
| Charter |
16.7
|
12.4
|
16.7
|
12.4
|
16.8
|
12.4
|
| FSU/China |
14.9
|
11.1
|
14.9
|
11.1
|
14.9
|
11.0
|
| General Aviation |
9.0
|
9.0
|
9.0
|
9.0
|
9.0
|
9.0
|
| Civil Subtotal |
15.4
|
11.5
|
15.3
|
11.4
|
15.4
|
11.5
|
| Military |
8.7
|
8.7
|
8.7
|
8.7
|
8.7
|
8.7
|
| Global Total |
15.2
|
11.4
|
15.0
|
11.3
|
15.3
|
11.4
|
|
|