| 9.2. Factors Affecting Aircraft Emissions
9.2.1. Demand for Air Travel
|
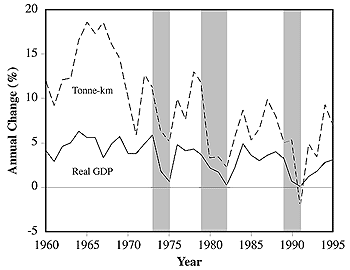
Figure 9-1:Relationship between economic growth
and traffic demand growth (IMF, WEFA, ICAO
Reporting
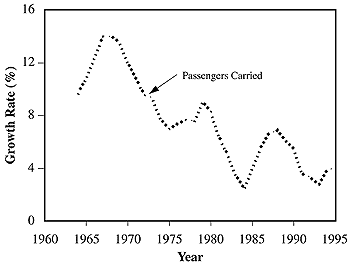
Figure 9-2: Growth rate of passengers carried (ICAO
Reporting Form A-1). Note the assumption of 5-year
moving average of annual growth rates, excluding
operations in the Commonwealth of Independent
States (CIS).
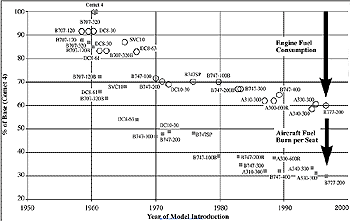
Figure 9-3: Trend in transport aircraft fuel efficiency.
|
In the past 50 years, the air transport industry has experienced rapid expansion
as the world economy has grown and the technology of air transport has developed
to its present state. The result has been a steady decline in costs and fares,
which has further stimulated traffic growth. As an example of this growth, the
output of the industry (measured in terms of tonne-km performed) has increased
by a factor of 23 since 1960; total GDP, which is the broadest available measure
of world output, increased by a factor of 3.8 over the same period (ICAO, 1997a).
Although growth in world air traffic has been much greater than world economic
growth, economic theory and analytical studies indicate that there is a high
correlation between the two, and most forecasts of aviation demand are based
on the premise that the demand for air transport is determined primarily by
economic development. Statistical analyses have shown that growth in GDP now
explains about two-thirds of air travel growth, reflecting increasing commercial
and business activity and increasing personal income and propensity to travel.
Demand for air freight service is also primarily a function of economic growth.
Air travel growth in excess of GDP growth is usually explained by other economic
and structural factors:
- Improvement in service offerings as routes and frequencies and infrastructure
are added, stimulation from reductions in airline fares as costs decline,
and increasing trade and the globalization of business (Boeing, 1998)
- Population and income distribution (Vedantham and Oppenheimer, 1998)
- Travel behavior, including travel time budgets and travel costs (Zahavi,
1981; Schafer and Victor, 1997).
Changes in technology and in the regulatory environment have also had great
effects on the growth in air travel demand. The modern era of air transportation
began in the 1960s, driven by the replacement of piston-engined aircraft with
jet aircraft that increased the speed, reliability, and comfort of air travel
while reducing the cost of operation. The continuing trend of declining fares
(as measured in constant dollars) began in this period. In real terms, fares
have declined by almost 2% per year since 1960. Deregulation of airline services
in the United States in 1978 allowed airlines to improve services by expanding
theirroute systems and reduce average costs by greatly increasing the efficiency
of scheduling and aircraft use. Trends toward liberalization of airline services
in Europe and elsewhere will continue to increase airline efficiency.
Sharp increases in oil prices have had important (though temporary) effects
on traffic demand. In addition to an adverse effect on the world economy, the
10-fold increase in crude oil prices in 1973-74 and further escalation in 1979-81
(since ameliorated) greatly increased aviation fuel prices. Air fares increased
in response to higher costs, with a resulting decline in demand growth rates.Figure
9-1 provides evidence of the relationship between the economy and traffic
demand by illustrating fluctuations in the rate of growth of each from 1960
to the present. The economic recessions of 1974-75, 1979-82 (largely caused
by the increase in oil prices), and 1990-91 (the Gulf War) and their impact
on air traffic are clearly visible.
The growth rate in global passenger demand over the past 35 years is shown
in Figure 9-2. Freight traffic, approximately 80% of
which is carried in the bellies of passenger airplanes, has also grown over
the same time period. The declining trend in the rate of growth as the size
of the industry has increased by more than 20-fold is a natural result of the
total size of the industry (it is difficult to sustain an "infant industry"
growth rate as size increases) and a maturing of certain markets-primarily those
in the developed world-that dominate the statistics.Changes in demand in regional
markets are given in Table 9-1 for the period 1970-95.
Over this period, global traffic measured in revenue passenger kilometers (RPK)
increased by a factor of 4.6 (Boeing, 1996). Table 9-1
is ordered by 1995 regional RPK value.
9.2.2. Developments in Technology
The trend in fuel efficiency of jet aircraft over time has been one of almost
continuous improvement; fuel burned per seat in today's new aircraft is 70%
less than that of early jets. About 40% of the improvement has come from engine
efficiency improvements and 30% from airframe efficiency improvements (Figure
9-3, after Figure III-A-1 in Albritton et. al, 1997).
The growth rate of fuel consumed by aviation therefore has been lower than
the growth in demand. Improvement in engine fuel efficiency has come mainly
from the increasing use of modern high-bypass engine technology that relies
on increasing engine pressure ratios and higher temperature combustors as a
means to increase engine efficiency. These trends have resulted in drastic decreases
in emissions of carbon moNOxide (CO) and unburned hydrocarbons (HC), though
they tend to increase emissions of oxides of nitrogen (NOx). As a result, total
NOx emissions from aircraft are growing faster than fuel consumption (see Figure
9-4, from NASA emissions inventories discussed in Section
9.3). A discussion of the technology required to reduce NOx emissions while
continuing to improve engine efficiency appears in Chapter
7.
Table 9-1: Regional share of total demand.
|
| Regional Traffic Flow |
1970
RPK x 109 |
1995
RPK x 109 |
1970-95
Growth
Factor |
1970
Market
Share |
1995
Market
Share |
1970-95
Change in
Share |
| Intra North America |
190.897
|
697.880
|
3.7
|
34.6%
|
27.5%
|
-7.1%
|
| Intra Europe |
61.275
|
317.099
|
5.2
|
11.1%
|
12.5%
|
1.4%
|
| North America Europe |
72.143
|
277.909
|
3.9
|
13.1%
|
11.0%
|
-2.1%
|
| China Domestic/Intra Asia/Intra Oceania |
10.234
|
207.405
|
20.3
|
1.9%
|
8.2%
|
6.3%
|
| North America Asia/Oceania |
14.760
|
188.799
|
12.8
|
2.7%
|
7.4%
|
4.8%
|
| Europe Asia |
6.732
|
134.343
|
20.0
|
1.2%
|
5.3%
|
4.1%
|
| Asia India/Africa/Middle East |
13.959
|
115.204
|
8.3
|
2.5%
|
4.5%
|
2.0%
|
| North America Latin America |
16.087
|
75.538
|
4.7
|
2.9%
|
3.0%
|
0.1%
|
| Europe Latin America |
7.124
|
73.090
|
10.3
|
1.3%
|
2.9%
|
1.6%
|
| Domestic Former Soviet Union |
75.496
|
67.603
|
0.9
|
13.7%
|
2.7%
|
-11.0%
|
| Japan Domestic |
8.181
|
61.607
|
7.5
|
1.5%
|
2.4%
|
0.9%
|
| Europe Africa |
18.478
|
61.045
|
3.3
|
3.4%
|
2.4%
|
-0.9%
|
| Intra/Domestic Latin America |
13.432
|
55.331
|
4.1
|
2.4%
|
2.2%
|
-0.3%
|
| Europe Middle East |
9.838
|
41.224
|
4.2
|
1.8%
|
1.6%
|
-0.2%
|
| Intra/Domestic Middle East Africa |
5.065
|
39.213
|
7.7
|
0.9%
|
1.5%
|
0.6%
|
| International Former Soviet Union |
3.677
|
29.508
|
8.0
|
0.7%
|
1.2%
|
0.5%
|
| Indian Subcontinent Asia/Middle
East/Oceania |
3.249
|
29.500
|
9.1
|
0.6%
|
1.2%
|
0.6%
|
| Europe Indian Subcontinent |
2.333
|
19.858
|
8.5
|
0.4%
|
0.8%
|
0.4%
|
| Intra/Domestic Africa |
5.826
|
16.808
|
2.9
|
1.1%
|
0.7%
|
-0.4%
|
| Intra Indian Subcontinent |
3.215
|
13.218
|
4.1
|
0.6%
|
0.5%
|
-0.1%
|
| North America Africa/Middle East |
1.149
|
10.777
|
9.4
|
0.2%
|
0.4%
|
0.2%
|
| U.S. Military Airlift |
8.112
|
3.605
|
0.4
|
1.5%
|
0.1%
|
-1.3%
|
| Total |
551.262
|
2536.561
|
4.6
|
100.0%
|
100.0%
|
0.0%
|
|
|