|
2.2. Impacts of Present Aviation on Atmospheric Composition
2.2.1. Modeling Changes in Atmospheric Ozone from Present
Aviation
Because of the substantial chemical and dynamic differences between the stratosphere
and the troposphere, individual atmospheric models have tended to focus on one
or the other of the regions. This separation has worked well in addressing primarily
stratospheric issues such as chlorofluorocarbons (CFCs) and tropospheric issues
such as regional pollution. Subsonic aircraft emissions, insofar as they are
injected into the interface between the two atmospheric regions, present a particularly
complex modeling challenge. To date, almost all model studies of subsonic aircraft
NOx effects have been conducted with models that emphasize tropospheric chemistry;
few contain an explicit representation of stratospheric chemistry. Most of the
following discussion will center on those efforts. However, two models of the
stratosphere-the Atmospheric Environmental Research (AER) and Commonwealth Scientific
and Industrial Research Organisation (CSIRO) models used in Chapter
4-have calculated stratospheric ozone responses to 1992 subsonic fleet emissions
of NOx. We discuss these results in Section 2.2.1.2
and use them in conjunction with the tropospheric model results to arrive at
a total atmospheric impact of NOx emissions from present subsonic aviation.
|

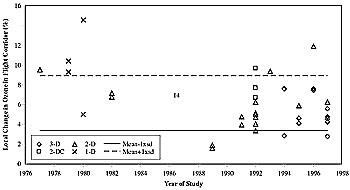
Figure 2-3: Maximum percentage increase in ozone concentrations, in principal traffic areas,
in the 9- to 13-km altitude range, 30-60°N latitude range, during summer, normalized by assumed global aircraft
NOx emission to 0.5 Tg N yr-1 and plotted against the year the calculation was performed.
|
Recognition of the importance of heterogeneous chemical processes has increased
steadily over the past 10 years; all atmospheric models now contain at least
some of the gas-surface interactions identified in laboratory studies. However,
relatively few global atmospheric models represent aerosol microphysics in a
way that allows for simulation of the impacts of aircraft aerosols on atmospheric
particle densities and surface areas. As a consequence, there has not yet been
much effort directed at modeling the effects of aircraft particle emissions
on atmospheric ozone. We evaluate one such study in Section
2.2.1.3.
2.2.1.1. Effects of Aircraft NOx Emisions on Tropospheric
Ozone
Model studies of the impact of NOx emissions from aviation on ozone levels
in the UT and LS have been performed with increasing sophistication since the
1970s. Most studies set up a base case without aircraft NOx emissions and a
perturbed case with the aircraft source added. Differences in atmospheric composition
and, ultimately, radiative forcing between the two cases are attributed to the
influence of aircraft emissions. There are detailed differences among the many
model studies that arise because of differences in the aircraft emission inventories
employed. There are, however, many other more crucial differences in the model
studies: The extent and accuracy of the treatment of atmospheric chemistry processes;
the treatment of other NOx sources besides aircraft; the treatment of dispersion,
transport, and advection of NOx species; and the adequacy of the treatment of
the underpinning description of the coupled chemistry and the global atmospheric
circulation in the UT and LS.
Many of the model studies note that the bulk of aircraft NOx emissions from
subsonic aviation occurs in an atmospheric region that is sensitive to these
emissions. Because of low background NOx levels-typically 50-200 ppt-in the
mid-latitude UT and LS, high NO/NO2 ratios, and low HOx concentrations, ozone
production (in terms of ozone molecules) per NOx molecule is more efficient
here than anywhere else in the atmosphere. Because the greenhouse blanketing
produced by a given atmospheric ozone increment is directly proportional to
the temperature contrast between radiation absorbed and radiation emitted, radiative
forcing efficiency is greatest for ozone changes near the tropopause (Lacis
et al., 1990), though its climate sensitivity may have a different response
(Hansen et al., 1997).
Table 2-1: Calculated changes in ozone inprincipal traffic
areas and 9- to 13-km region during summer for five selected models employed
in Chapter 4 for the 1992 aircraft subsonic fleet NOx emissions of 0.5 Tg
N yr-1(see Chapter 9), together with the range of previous studies shown
in Figure 2-3.
|
| |
Local OzoneIncreases during July |
|
| Model |
ppb |
% |
| |
|
|
| BISA/IMAGES |
4.4 |
4.3 |
| HARVARD |
6.0 |
4.4 |
| UiO |
5.5 |
3.5 |
| UKMO |
12.7 |
7.6 |
| Tm3 |
10.0 |
|
| |
|
|
| Range of Previous 48 Studies |
3-12 |
3-9 |
|
|
|
In completing our assessment of ozone impacts from present subsonic aircraft
NOx emissions, we have gathered results from 48 model studies, which are listed
in the bibliography at the end of the chapter. In each case, the model results
have been normalized by the assumed global aircraft NOx emission source strength
and put on the common basis of 0.5 Tg N yr-1. There are, however, differences
in the spatial distributions used in these inventories, and local NOx and ozone
concentration impacts will not necessarily scale accurately with global emission
source strength. Despite this important reservation, global emission source
strength is a useful index in a first examination of the model results.
Based on these results, we conclude that subsonic aviation has impacts on
atmospheric composition in the principal traffic areas at 9-13 km altitude,
30-60°N latitude, averaged over chemically significant time scales of up to
a few days. These impacts may be summarized as follows for normalized NOx emissions
of 0.5 Tg N yr-1:
Significant local increases in NOx levels, by up to hundreds of ppt
Significant local increases in ozone, by up to 12 ppb, over a region including
air traffic corridors and polewards of them, averaged over available calculations
for January and July
Ozone increases of 2-14%, at their maximum in July, downstream and extending
to the north of principal traffic areas, reflecting the long atmospheric
lifetime of ozone in the UT and LS
Ratios of ozone increments to NOx increments on the order of 100, reflecting
the high efficiency of the ozone production cycle in the UT and LS
Globally averaged ozone inventory increases of 3-10 Tg, or 1-3%, up to an
altitude of about 15 km
Increases in tropospheric hydroxyl radical inventories of 0.3-3% globally
up to an altitude of about 15 km.
Despite improvements in the realism with which processes have been represented
in the models, the increase in dimensionality from 2-D to 3-D has not been accompanied
by a change in the likely magnitude of local NOx and ozone changes anticipated
from aircraft NOx emissions, when normalized by the assumed aircraft NOx emission
to 0.5 Tg N yr-1 (Figure 2-3).
The original 2-D (altitude-latitude) model studies of the tropospheric ozone
impacts of subsonic NOx emissions are close to the (mean + 1xsd) line from the
entire ensemble of studies. 2-D model estimates have declined steadily so that
by 1992 they were close to the (mean - 1xsd) line. The original 1-D studies
showed a large amount of scatter and have not been used extensively for assessment
purposes for the past decade or so. 2-D channel (altitude-longitude) models
have been applied to the aircraft assessment as an interim strategy prior to
3-D (altitude-latitude-longitude) model development. 2-D channel model results
are toward the high end of the range of results.
3-D models have been employed increasingly from 1994 onward, with the results
lying toward the low end of the overall spread of model results. 3-D model results
still show a considerable amount of scatter, and there is no evidence that the
move from 2-D to 3-D models or the selection of 3-D models in Chapter
4 has improved inter-model consistency or overall predictive confidence.
Regardless of how 2-D model results compare with zonally averaged 3-D model
results, a crucial advantage of 3-D models is that they can account for zonal
asymmetries and, in principle, be evaluated more decisively against local observations.
Consequently, more confidence can be gained in their predictive capabilities
for aircraft assessments (see Sections 2.3.1.1 and
2.3.1.2).
Based on all model results compiled for this assessment, our estimate of the
likely ozone increase at its maximum in the principal traffic areas-9-13 km
altitude, 30-60°N latitude-from 1992 subsonic aviation and during summer is
about 6%, or 8 ppb, for a global aircraft NOx emission of 0.5 Tg N yr-1 (1.65
Tg NOx as NO2 yr-1; see Chapter 9).
Chapter 4 focuses attention on the development of future
scenarios for subsonic aircraft NOx emissions; six 3-D global models have been
employed to assess future impacts of subsonic aircraft. Table
2-1 shows ozone changes calculated in some of these models for 1992 subsonic
operations compared with model results presented in previous studies. The latest
model results in Table 2-1 appear to lie well within
the central range of estimates from previous studies.
The estimates in Table 2-1 can be compared with
previous assessments of the likely ozone impacts of NOx emissions from present
aviation. The WMO-UNEP (1995) assessment described model results available to
the end of 1993 as preliminary and indicative of maximum ozone increases of
4-12% at around 10 km for 30-50°N. The above estimates encompass a narrower
range than that given in the WMO-UNEP (1995) assessment and suggest that the
true value is at the lower end of previous estimates. An assessment prepared
for the European Commission (Brasseur et al., 1998) concluded that the current
fleet of commercial aircraft should have increased NOx abundances by 50-100
ppt near 200 hPa, with a corresponding increase in ozone concentrations of 5-9
ppb (i.e., 4-8%), during summertime. This latter range is consistent with the
range identified in the present study, based on the five selected 3-D models.
2.2.1.2. Effects of Aircraft NOx Emissions on Stratospheric
Ozone
 |
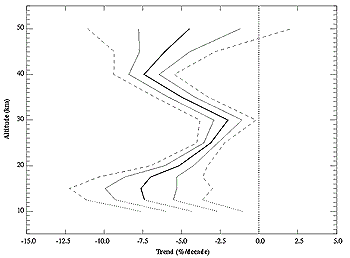
| Figure 2-4: Estimate of mean trend using
all four measurement systems (i.e., Umkehr, ozonesondes, SBUV, and SAGE
I/II) at northern mid-latitudes (heavy solid line). Combined uncertainties
are also shown as 1s (light solid lines) and 2s (dashed lines). Combined
trends and uncertainties are extended down to 10 km as shown by the light
dotted lines. The results below 15 km are a mixture of tropospheric and
stratospheric trends, and the exact numbers should be viewed with caution.
Combined trends have not been extended lower into the troposphere because
the small sample of sonde stations have an additional unquantified uncertainty
concerning their representativeness of mean trends (WMO, 1998). |
2-D models have been developed extensively over the past decade in response
to the need for credible predictions of CFC impacts on stratospheric ozone and
more recently for understanding the effects of future supersonic (high speed
civil transport, or HSCT) aircraft fleets. Emphasis in these models has been
placed on ClOx, HOx, and NOx chemistry in the 20-40 km region of the atmosphere,
where the CFC and HSCT effects are expected to be manifested. Model calculations
for the 1992 subsonic aircraft fleet have been performed by the AER and CSIRO
2-D models, described in detail in Chapter 4. For these
calculations, the models have used the approach described in Section
2.2.1.1; namely, they have set up a base case without aircraft NOx emissions
and a perturbed case with the aircraft source added. They also have both used
the subsonic fleet emission inventory described in Chapter 9.
The results of the two studies are in close agreement and yield the following
conclusions:
Approximately 20% of subsonic emissions are released directly into the
stratosphere; this result is on the low end of empirically based estimates,
resulting in roughly a 1% increase in summertime NOx levels existing just
above the tropopause at 45°N latitude.
The aircraft-induced increase in lowermost stratospheric NOx causes an increase
in ozone. Peak ozone increases are approximately 0.5% at northern mid-latitudes
and at altitudes immediately above the tropopause. The total column ozone
change resulting from stratospheric aircraft emissions is approximately
0.1%.
A very small amount of aircraft NOx is transported to altitudes above 22
km, where it acts to decrease ozone concentrations slightly.
2.2.1.3. Effects of Aircraft Aerosol Emissions
A number of previous model studies have examined the effects of HSCT sulfate
aerosols on stratospheric chemistry; several new studies are discussed in Chapter
4. A key uncertainty in these calculations has been the degree to which
emitted sulfur forms submicron sulfate particles in the aircraft plume (see
Section 3.2.3). As part of the Chapter
4 studies, the AER and UNIVAQ stratospheric models have calculated the response
of stratospheric ozone to the subsonic fleet (year 2015) for a range of assumed
SO2-to-particle conversion efficiencies. Details
of those studies appear in Section 4.4.1.2. A rough
estimate of the effect of sulfur emissions from the 1992 fleet can be made by
scaling the 2015 results to 1992 emission levels. This calculation results in
an estimate for the column ozone change at 45°N of approximately -0.1%.
The potential role of subsonic aircraft-generated soot in stratospheric ozone
depletion has been investigated by Bekki (1997) using a 2-D model that includes
heterogeneous reactions of HNO3, NO2, and ozone on soot. Using modeled aircraft
soot aerosol distributions that were broadly consistent with observations, the
model yields increased losses of ozone (approximately -0.2% column change at
45°N for the 1992 fleet) relative to the same model without soot chemistry.
Moreover, inclusion of soot chemistry improves model agreement with the observed
trend in LS ozone depletion. However, recent laboratory measurements indicating
that soot is a reaction consumable do not support a major assumption of the
Bekki model that soot acts as a catalyst.
 |
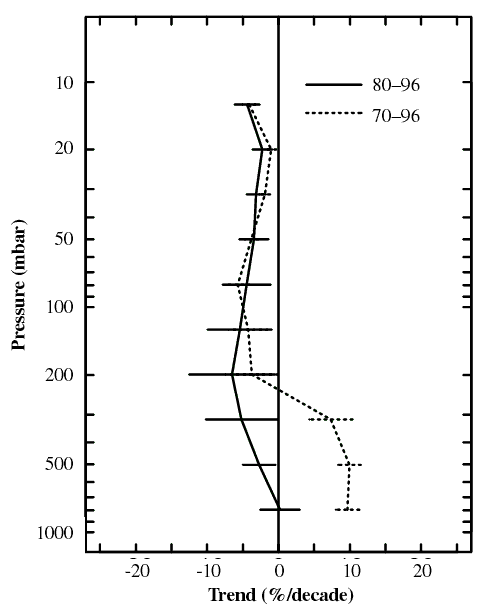
| Figure 2-5: Annual trends for the periods 1970-96 and
1980-96 shown by ozonesonde measurements at Hohenpeissenberg, Germany. 95%
confidence limits are shown [adapted from WMO (1998) by J. Logan]. |
The degree to which soot consumption affects the Bekki calculations can be
estimated as follows: If the heterogeneous reaction between ozone and soot proceeds
at the highest reported rate (the one used in the Bekki calculation), namely
g(O3) = 3.0 x 10⁻⁴ (Stephens et al., 1986; Fendel et al., 1995; Rogaski et al.,
1997), the time required to consume the mass of soot present in the stratosphere
would be approximately 10 minutes. It is important to note that this result
is independent of the soot surface-to-volume ratio; it depends only upon the
ozone concentration, which is taken to be 1011 cm-3 at 10-km altitude. At this
reaction rate, only 5 hours would be required to consume the entire soot particulate
population at 10 km (assuming 5 x 10⁷ carbon atoms cm-3 at a soot loading of
1 ng m-3) and cause the effective soot-ozone reaction rate to drop to zero.
Laboratory evidence suggests that the soot-ozone reaction rate decreases after
consumption and alteration of the top surface carbon layer (Stephens et al.,
1986). Small reported laboratory g values-on the order of 3.0 x 10⁻⁵-likely
reflect the reaction rate associated with a "deactivated" laboratory soot surface.
Using this value for g, the time required to consume individual particles of
soot would be less than a day, and the time to consume all atmospheric soot
would be lengthened to approximately 3 weeks. Although this change in reaction
rate extends the lifetime of atmospheric soot, it comes at the expense of the
overall ozone destruction rate. Accordingly, our analysis indicates that the
massof soot in the UT and LS does not seem to be sufficient to quantitatively
affect ozone, regardless of the reaction rate chosen.
In support of this conclusion, we note that in situ measurements in the engine
exhaust of a Concorde supersonic aircraft in the LS have been used recently
to constrain heterogeneous reaction rates on soot particles in a plume model
(Gao et al., 1998). Gao et al. inferred low reactivity for the ozone-soot interaction;
coupled with the measured abundance of the soot aerosol, Gao et al. reach the
same conclusion that we derived from our qualititative arguments. In summary,
the few model calculations performed suggest that subsonic aircraft sulfate
and soot emissions in the stratosphere act as substrates for ozone depletion.
The magnitude of the depletions is likely to be small relative to ozone increases
from NOx emissions, but the depletions are highly uncertain because of the poorstate
of understanding and model development relative to aerosol chemistry.
|