|
6.1.2. Aircraft-Induced Climate Change
|
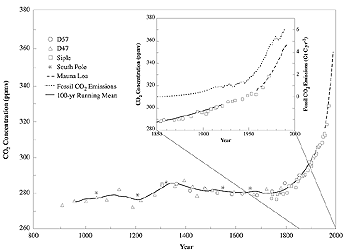
Figure 6-3: CO2 concentration over the past 1000
years from ice core records (D47, D57, Siple, and
South Pole) and (since 1958) from Mauna Loa,
Hawaii, measurement site.
|
Aircraft emissions are expected to modify the Earth's radiative budget and
climate as a result of several processes (see also Figure
6-1): emission of radiatively active substances (e.g., CO2
or H2O); emission of chemical species that produce or
destroy radiatively active substances (such as NOx, which
modifies O3 concentration, or SO2,
which oxidizes to sulfate aerosols); and emission of substances (e.g., H2O,
soot) that trigger the generation of additional clouds (e.g., contrails).
The task of detecting climate change is already difficult; the task of detecting
the aircraft contribution to the overall change is more difficult because aircraft
forcing is a small fraction of anthropogenic forcing as a whole. However, aircraft
perturb the atmosphere in a specific way because their emissions occur in the
free troposphere and lower stratosphere, and they trigger contrails, so the
aircraft contribution to overall climate change may have a particular signature.
At a minimum, the aircraft-induced climate change pattern would have to be significantly
different from the overall climate change pattern in order to be detected.
The climatic impact of aircraft emissions is considered on the background of
other anthropogenic perturbations of climate. The present assessment is based
on the IS92 scenarios used to represent alternative futures in the Second Assessment
Report (IPCC, 1996); it does not incorporate recent observed trends in methane
(Dlugokencky et al., 1998), nor any implications from the Kyoto Protocol. The
scenarios for aircraft flight patterns, fuel burn, and emissions are described
in Chapter 9. Atmospheric perturbations are taken from
detailed atmospheric models (Chapters 2, 3,
and 4), except for CO2 accumulation
(which is discussed in this chapter).
The largest, single, known radiative forcing change over the past century is
from the increase in CO2, driven primarily by the burning
of fossil fuel. Figure 6-3 shows the change in CO2
over the past 1,000 years; the CO2 concentration increased
from about 280 ppmv in 1850 to about 360 ppmv in 1990. Figure
6-4 shows six IPCC projections for anthropogenic emissions of CO2
(labeled IS92a-f) and predicted atmospheric CO2 concentrations.
We take the central case, IS92a, as the future scenario with which to compare
aircraft effects. The central aircraft scenario (Fa1) assessed here matches
the economic assumptions of IS92a. Radiative forcing for IS92a is shown in Figure
6-5a, including total radiative forcing and individual contributions.
|
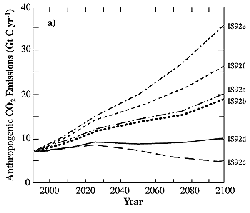
Figure 6-4: a) Total anthropogenic CO2 emissions
(Gt C yr-1) under the IS92 emission scenarios.
|
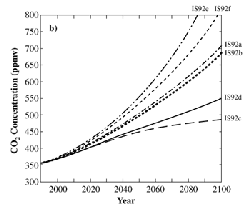
Figure 6-4: b) the resulting atmospheric CO2
concentrations (ppmv) calculated using the "Bern" carbon cycle model (IPCC,
1996, Figure 5).
|
|
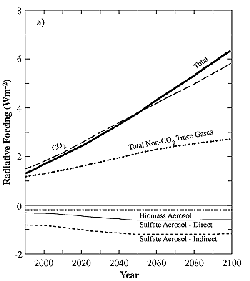
Figure 6-5: a) Radiative forcing components resulting
from the IS92a emission scenario for 1990 to 2100.
The "Total Non-CO2 Trace Gases" curve includes the radiative forcing from
CH4 (including CH4-related
increases in stratospheric water vapor), N2O,
tropospheric O3, and the halocarbons (including the
negative forcing effect of stratospheric O3 depletion).
Halocarbon emissions have been modified to take
account of the Montreal Protocol and its Adjustments
and Amendments. The three aerosol components are
direct sulfate, indirect sulfate, and direct biomass
burning.
|
¨
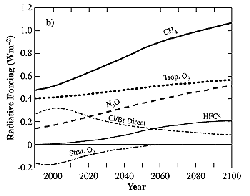
Figure 6-5: b) Non-CO2
trace gas radiative forcing components. "Cl/Br direct" is the direct radiative
forcing resulting from Cl- and Br-containing halocarbons; emissions are assumed
to be controlled under the Montreal Protocol and its Adjustments and Amendments.
The indirect forcing from these compounds (through stratospheric
O3 depletion) is shown separately (Strat.
O3). All other emissions follow the IS92a scenario.
The tropospheric O3 forcing (Trop.
O3) takes account of concentration changes resulting
only from the indirect effect from CH4 (IPCC, 1996,
Figure 6b-c).
|
|