|
6.5. Relation between Radiative Forcing and Climate Change
6.5.1. Radiative Forcing and Limits of the Concept
|

Figure 6-9: Zonal and annual mean radiative
imbalance (W m-2) at the tropopause (after
adjustment of stratospheric temperature) as a
function of latitude as a result of air traffic for 1992.

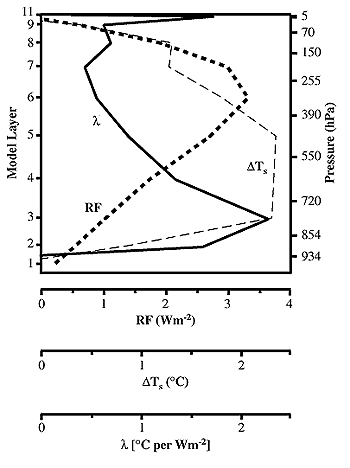
Figure 6-10: Radiative forcing (dotted line), global
mean surface temperature change including all
internal feedback processes (dashed line), and climate
sensitivity parameter l (solid line) from 100 DU
additional ozone as a function of altitude (model
layer) to which ozone was added. The plot is based on
results of a simplified GCM (data from Table 3 by
Hansen et al., 1997b).
|
In Sections 6.3 and 6.4 we have
reported radiative forcing calculations for various aspects of aircraft-induced
perturbations to radiatively active substances. One of the basic ideas behind
this calculation was the validity of the concept of RF as a quantitative predictor
for climate change (see Section 6.2.1). We implicitly
assume that contributions from individual perturbations to the change in global
mean surface temperature are additive, at least as a first-order approximation.
The radiative forcing concept requires a quasi-constant climate sensitivity
parameter l within the same model for different types of RF and different magnitudes
of RF. This assumption holds for changes in most of the well-mixed greenhouse
gases and for variations in solar irradiance (e.g., Hansen et al., 1984b; Shine
et al., 1995; Hansen et al., 1997b; Roeckner et al., 1999). As noted in previous
IPCC reports (e.g., IPCC, 1996), there are limitations to the applicability
of the radiative forcing concept, especially for RFs that are highly variable
geographically or seasonally (i.e., typical of aircraft perturbations).
As a clear example of large spatial differences in radiative forcing, the annual
mean radiative imbalance as a function of latitude is shown in Figure
6-9 for the big four RFs for subsonic aviation in 1992. Whereas the radiative
imbalances from CO2 (positive) and CH4
(negative) are nearly uniform from south pole to north pole, those from O3
(peaking at 0.065 W m-2 at 30°N) and contrails (peaking
at 0.10 W m-2 at 40°N) are highly concentrated in northern
mid-latitudes. The global means of all four contributions are about equal (see
Table 6-1). The NOx-driven
perturbations to O3 and CH4 produce
RFs (+0.23 and -0.14 W m-2, respectively) that are of
similar magnitude and in part cancel. However, the latitudinal distribution
of the radiative imbalance from these two perturbations does not cancel: The
combined O3+CH4 forcing is positive
in the Northern Hemisphere and negative in the Southern Hemisphere. The response
of the climate system to such geographically non-homogeneous forcing is unknown.
At least regional differences in climate response can be expected, and there
may even be differences in the global mean response (see Section
6.5.2).
The limitations and advantages of the radiative forcing concept have recently
been demonstrated by Hansen et al. (1997b). A classic test case considers radiative
forcing and associated climate change for ozone perturbations occurring at different
altitudes. In a series of numerical experiments with a low-resolution GCM (Hansen
et al., 1997a), the impact of 100 DU ozone added to the various model layers
was investigated. As in the calculations of Lacis et al. (1990), Hauglustaine
and Granier (1995), Forster and Shine (1997), and Brasseur et al. (1998), strong
variation of radiative forcing with the altitude of ozone perturbation is found:
negative forcing for perturbation in the middle stratosphere, and positive forcing
for perturbation in the troposphere and lower stratosphere. RF is a maximum
for a perturbation close to the tropopause (Figure
6-10, dotted curve).
Without cloud and water vapor feedbacks, the change in global-mean surface
air temperature exhibits a similar dependency on the altitude of the ozone perturbation
as radiative forcing does (with a maximum close to the tropopause, not shown
in figure). However, when all model feedbacks are included, the maximum global-mean
surface temperature change in the GISS model occurs for an ozone perturbation
in the middle troposphere (Figure 6-10, dashed
line). The climate sensitivity parameter l varies widely as a function of the
altitude of the ozone perturbation varies widely from the middle stratosphere
to the surface layer (Figure 6-10, solid line).
Peak sensitivity in this model occurs in the lower troposphere because of feedbacks
on clouds. However, for the altitude range at which aircraft O3
perturbations contribute significantly to the total RF (e.g., 2-14 km), the
value of l is within a factor of 2 of the climate sensitivity parameter for
doubling of CO2 in the same model, 0.92 K/(W m-2)
(Hansen et al., 1997b).
In GCM experiments with a similar model that focused on aircraft-like perturbations,
the specific feedbacks that minimized the response for aircraft releases were
high-level cloud cover (Rind and Lonergan, 1995-considering ozone impacts) and
sea ice (Rind et al., 1996-considering water vapor releases). Sensitivity of
l to layered perturbations is also found by Ponater et al. (1998) but with opposite
sense: The climate sensitivity parameter for aircraft-induced ozone is higher
than that for well-mixed greenhouse gases. The difference in these results likely
depends on the formulation of clouds within the two models.
With our present understanding of climate modeling and critical feedback processes
in the troposphere, we can do no better than adopt the tropopause value of RF
after stratospheric adjustment. However, for aircraft-induced climate perturbations,
the additivity of RFs across all perturbations cannot be taken for granted and
adds further uncertainty.
|