|
5.5.2. Sulfur
Aerosols result from complex atmospheric processes in which sulfur emissions
play an important role. Besides sulfur, other substances, like NOx, ammonia,
and small particles from the burning of fossil fuels and biomass, are involved
in these processes.
|
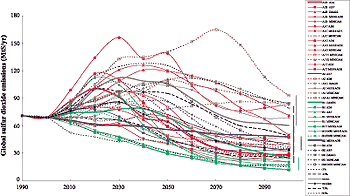
Figure 5-12: Standardized global SO2 emissions
for SRES scenarios, classified into four scenario families (each denoted
by a different color code - A1, red; A2, brown; B1, green; B2, blue).
Marker scenarios are shown with thick lines without ticks, globally harmonized
scenarios with thin lines, and non-harmonized scenarios with thin, dotted
lines (see Table 4-3). Black lines show percentiles,
means, and medians for SRES scenarios. For numbers on the two additional
illustrative scenarios A1FI and A1T see Appendix
VII.
|
Global anthropogenic sulfur emissions are estimated to range between 65 and
90 MtS in 1990 (Houghton et al., 1995; Benkovitz et al., 1996; Olivier et al.,
1996; WMO, 1997). Reviews of most recent inventories, given in Smith et al.
(2000) and Grübler (1998), indicate a most likely value of 75 ± 10 MtS. These
reviews draw on a large body of literature sources and sulfur inventories (in
particular the EMEP and CORINAIR inventories for Europe, NAPAP for North America,
and the most recent inventories available for Asia, including Akimoto and Narita
(1994), Foell et al. (1995), and Kato (1996)). Anthropogenic emissions add to
natural sulfur flows, which are estimated to range between 4 and 45 MtS (Houghton
et al., 1995). Pepper et al. (1992) adopted an intermediary, constant natural
sulfur flux of 22 MtS for the IS92 scenario series.
Even with a comparatively good agreement on global sulfur emission levels,
important uncertainties remain at the sector and regional levels (discussed
in more detail in Alcamo et al. (1997) and Grübler (1998)). The main sources
of uncertainties are a lack of detailed inventory data (especially for developing
countries outside Asia, but also for the non-European part of Russia), uncertainties
in sulfur contents of fuels (especially coal) in many regions, and the use of
different base years for development of sulfur inventories. For instance, inventories
and scenario studies for China and Centrally Planned Asia give a range of sulfur
emissions that differ by more than a factor of two (8.4 to 18 MtS) for the year
1990 (Grübler, 1998).
Base-year differences in the available data sources are especially important
because regional sulfur emissions trends have changed drastically in the past
decade. Although they decreased strongly in Europe and North America as a result
of sulfur control policies, they increased rapidly in Asia with growing energy
demand and coal use. For instance, between 1980 and 1995 sulfur emissions declined
by 59% in Western Europe and Russia (albeit for entirely different reasons -
environmental policy limiting sulfur emissions in Western Europe versus a massive
economic depression in Russia), by 37% in Eastern Europe, and by 36% in North
America (ECE, 1997). Conversely, emissions in China rose rapidly, from an estimated
6.6 MtS in 1985 to 9.1 MtS in 1994, or by 38% (Sinton, 1996; Dadi et al., 1998).
These diverging emission trends and their rapid changes also require a continuous
updating of available gridded sulfur emission inventories (e.g., Dignon and
Hameed, 1989; Spiro et al., 1992; Benkovitz et al., 1996; Olivier et al., 1996)
that in, some instances, still rely on outdated 1980 emissions data.
Global base-year (1990) sulfur emission values from the SRES models range from
63 to 77 MtS, with the addition of 3 MtS from international shipping9.
This difference reflects the existing uncertainty in sulfur emission estimates,
particularly at the regional level. The range is within the range of values
given by global inventories.
|
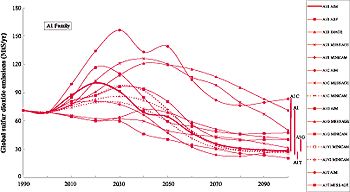
Figure 5-13a: Standardized global SO2 emissions
in the A1 scenario family. The marker scenario is shown with a thick line
without ticks, the globally harmonized scenarios with thin lines, and
the non-harmonized scenarios with thin, dotted lines (see Table 4-3). In the SPM, A1C and A1G scenarios are merged into one fossil-intensive
A1FI scenario group (see also footnote
2).
|
Model differences at the regional level are even larger, which reflects the
greater uncertainty of emission inventories at this level, particularly outside
the OECD countries. To standardize sulfur emissions, the number of SRES reporting
regions was increased to six regions, by splitting Latin America from the ALM
region and Centrally Planned Asia and China from ASIA. Important differences
in economic development status and resource endowments lead to different patterns
of sulfur emissions across all SRES scenarios. Regional emissions were standardized
(see Box 5-1) and then aggregated to the global
level. Global standardized base-year emissions for 1990 for the SRES scenarios
are equal to 70.9 MtS, in line with the literature range of global emission
inventories given above. The regional sulfur emission profiles were also used
to generate spatially gridded emission patterns (see Section
5.6.2 below).
Concerning future emissions of sulfur, the SRES scenarios reflect recent literature
and trends of sulfur control scenarios, as well as the conclusions from the
1994 evaluation of the IS92 scenarios (Alcamo et al., 1995). Despite considerable
scenario variability, all scenarios portray similar emission dynamics - at various
future dates (between 2020-2030 and 2070, depending on the scenario and its
underlying storyline), global SO2 emissions reach a maximum level and decline
thereafter (Figure 5-12). By 2030 sulfur emissions range between 40 and 160
MtS10,
by 2070 between 20 and 165 MtS, and by 2100 between 10 and 95 MtS. Emission
trajectories of the SRES scenarios reflect a combined impact of different scenario
driving forces (local air quality concerns, structural change in energy supply
and end-use, etc.), which lead to a gradual decline in sulfur emissions in the
second half of the 21st century.
Importantly, all SRES scenarios are sulfur-control scenarios only and do not
assume any additional climate policy measures. There is, however, an indirect
effect of GHG emission reduction from sulfur-control policies that result in
energy conservation and inter-fuel substitution from high sulfur to low sulfur
fuels (e.g., from coal to gas).
5.5.2.1. A1 Scenario Family
The A1 family of scenarios covers most of the range of the 40 SRES scenarios
(Figure 5-13a). The A1B-AIM marker is in the middle of the range and its trajectory
is similar to those of many other scenarios - a rapid increase in the near term
followed by a decline. Increasing fossil fuel use in developing countries combined
with low levels of SO2 controls produces the near-term increase in emissions.
After 2025, per capita incomes reach levels at which countries place more emphasis
on the environment, resulting in emission controls on SO2 (see Section
4.4.10). These controls, combined with a transition from fossil fuels to
non-fossil energy, result in declining emissions. More detailed information
as to how SO2 emissions are treated in the A1B-AIM scenario is provided in Box
5-3.
Another A1 family scenario, A1G-MiniCAM, shows similar behavior for the same
reasons, although the increase and subsequent decline in emissions is less pronounced.
The MiniCAM model has a higher level of SO2 controls, but also a greater fossil
fuel use, resulting in slightly higher SO2 emissions in 2100.
The A1T, A1G, and A1C scenario groups assume various roles for the development
of energy resources and technologies (the coal-intensive A1C scenario group,
the oil- and gas-intensive A1G group, and the A1T scenario group with accelerated
non-fossil technology diffusion). Consequently, they span a very wide range
of future sulfur emissions, ranging from 20 MtS by 2100 in the A1T-MESSAGE scenario
to 83 MtS in the A1C-AIM scenario.
|
Box 5-3: Sulfur Emissions in
the A1B-AIM Marker Scenario
In the A1B-AIM marker scenario, global SO2 emissions increase rapidly
from 70.6 MtS in 1990 to reach a peak around 2020 at 101 MtS, and subsequently
decline to around 30 MtS after 2050. The global SO2 emission trajectory
follows that of the developing countries, for which emissions increase
because of the rapid growth of fossil fuel use driven by rapid economic
development, combined with a lack of sulfur controls that reflect investment
and infrastructure limitations. With an increase in personal incomes in
developing countries and associated concerns about local air pollution,
SO2 becomes controlled in a similar way to that in developed countries,
for which SO2 emissions have declined in the past two decades. The sources
of SO2 emissions tracked by the AIM model include energy use, industrial
production processes (steel and cement production), and biomass burning.
The major factors of SO2 emission reduction are changes in the fuel mix,
use of advanced energy technology, and implementation of desulfurization
technology. In the A1B-AIM scenario, the volume and share in total primary
energy of coal and crude oil changes drastically over time (Table 5-10).
| Table 5-10: Coal and crude oil in the A1-AIM
scenario in terms of primary energy requirements (EJ) and as shares
of total primary energy (%). |
|
| |
1990
|
2050
|
2100
|
|
| Coal |
85 EJ
|
24.6%
|
140 EJ
|
11.7%
|
41 EJ
|
2.0%
|
| Crude Oil |
126 EJ
|
36.5%
|
181 EJ
|
15.0%
|
107 EJ
|
5.0%
|
|
Before 2050, both advanced energy technology and desulfurization play
a key role in the SO2 emissions reduction. In the power generation sector,
integrated gasification combined cycle (IGCC), fluidized bed combustion
(FBC), and flue-gas desulfurization (FGD) technologies are adopted. In
the industry and commercial sectors, FBC boilers, fuel desulfurization
and FGD are adopted. SO2 emission reductions are also achieved in the
transport sector. Table 5-11 summarizes the SO2 abatement effect of these
technologies.
| Table 5-11: SO2 emission reductions (%) by technology
and sector in the A1-AIM scenario. |
|
| Technologies |
SO2 Emission reduction rate |
Note |
|
| Power generation |
|
|
| IGCC |
96% |
Introduced after 2015 |
| FBC |
95% |
|
| FGD |
98% |
|
| Industry and commercial sector |
|
|
| FBC |
92% |
|
| FGD |
95% |
|
| Fuel desulfurization |
70% |
|
| Transport sector |
|
|
| SO2 emission control |
75% |
|
|
Income levels determine the time at which these technologies are introduced
in the A1B-AIM scenario. According to the experience of SO2 emission controls
in developed countries, low-income developing countries will start to
introduce SO2 emission control technologies when GDP reaches around US$3500
per capita in 1990 dollars. In A1B-AIM this threshold level is reached
in a period of about 30 years.
|
|