5.6.1.2. Land-Use Carbon Dioxide Emissions
Changes in land use are influenced primarily by the demand for cropland and
grassland (to supply plant and animal food to the world population) and by the
role of biomass energy. The uncertainty of emission estimates is reflected in
the models used to quantify the SRES scenarios - in 1990 they range between
1.0 and 1.6 GtC and the spread at the regional level is even larger. In all
the SRES marker scenarios, most emissions related to land use originate from
the ASIA and ALM regions (Tables 5-13a-d). In the
industrialized regions, the land-use change emissions in 2100 vary from -0.40
to +0.04 GtC. In the developing regions emissions from land-use change span
a larger range (from -0.56 to +0.35 GtC).
|
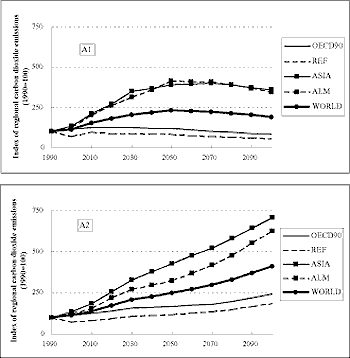
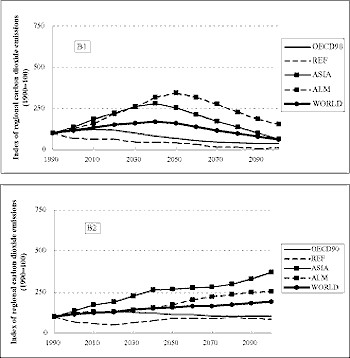
Figure 5-16: Regional
and global CO2 emissions in the four SRES markers scenarios
A1B, A2, B1,
and B2, shown as an index (1990 = 100). The numbers for the additional
two
illustrative scenarios for the A1FI and A1T scenario groups noted
in the Summary for
Policymakers can be found in Appendix
VII.
|
5.6.1.3. Total Carbon Dioxide Emissions
|
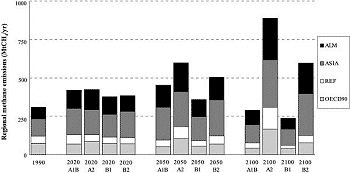
Figure 5-17: Anthropogenic CH4 emissions
in the SRES
marker
scenarios by region. The numbers for the additional
two illustrative
scenarios for the A1FI and A1T scenario
groups noted
in the Summary
for Policymakers can be found
in Appendix
VII.
|
Adding land-use CO2 emissions to the energy- and industry-related emissions
does not make significant changes to the distribution of emissions across regions
(Figures 5-14 and 5-15).
Table 5-14 provides an overview of the relative
shares of the industrialized and developing regions within global CO2 emissions.
On average, the SRES marker scenarios project a shift in relative contribution
in both energy- and industry-related and total CO2 emissions from the industrialized
to developing regions. In general, the relative contribution of industrialized
regions is the lowest in A1 and the highest in B2.
Shifts in the regional emission shares (Table 5-13a-d)
result from different developments in regional emission trajectories. To illustrate
this, the trajectories were normalized to the base year (1990 = 100 for each
region) and are presented in Figure 5-16.
Figure 5-16 confirms that CO2 emissions in the ASIA and ALM regions in all
the SRES markers grow much faster than in the industrialized regions. It also
illustrates that the global pattern is strongly influenced by the developing
region trajectories. Furthermore, reflecting different development perspectives
in the four SRES families, CO2 emissions grow differently in ASIA and ALM. In
the A1B marker, emission trajectories in ALM and ASIA are roughly parallel over
the entire time horizon. In the B1 marker, this is only true in the earlier
years. As the emission of ALM peaks and then declines later than that of ASIA,
emission trajectories diverge strongly in the second half of the 21st century.
In the A2 marker, emissions in ALM start to grow at a lower rate than in ASIA,
but subsequently catch up and later the two are again fairly close. Finally,
in the B2 marker, ALM emissions initially grow at a modest rate, close to those
for the OECD90 region and the world average. In later years, the growth in ALM
exceeds the global rate, but total carbon emissions remain far below those in
the ASIA region (Figures 5-15, 5-16).
|
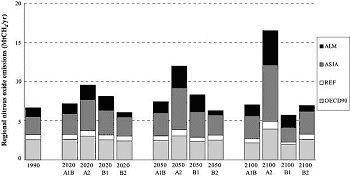
Figure 5-18: Anthropogenic N2O emissions
in the SRES
marker scenarios by region. The numbers for the additional
two
illustrative scenarios for the A1FI and A1T scenario
groups
noted
in the Summary for Policymakers can be
found
in
Appendix
VII.
|
5.6.1.4. Methane
The resultant CH4 emission trajectories in the four SRES markers are displayed
in Figure 5-17. By 2020, regional differences between the four markers are minimal.
In 2050, the largest difference is the relative share of the REF region in the
A2 marker, attributable primarily to an increased coal and gas production in
this region. By 2100, the A2 marker has the largest CH4 emissions in all the
regions as compared to the other markers (Tables 5-13a-d,
Figure 5-17). This arises from the "heterogeneous" nature of the A2 storyline,
in which each region has to rely primarily on its own resources and progress
in the renewable energy sector is quite limited. The second highest methane
emissions are attained in the B2 marker, which also has a "regional" orientation,
but with a more environmentally sustainable emphasis as compared to the A2 marker.
Starting from 2100, both A1B and B1 markers have notably lower CH4 emissions
in all the regions in comparison with the A2 and B2 markers (Figure 5-17). The
regional emission allocation changes considerably from 1990 to 2100; all four
markers project much greater percentages of emissions in the developing regions
(ASIA and ALM).
5.6.1.5. Nitrous Oxide
|
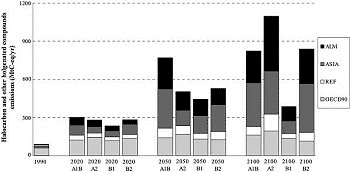
Figure 5-19: Halocarbons and other halogenated
compounds emissions in the SRES marker scenarios
by region. The numbers
for the additional two illustrative
scenarios for the A1FI and A1T scenario
groups noted
in the Summary for Policymakers can be found in
Appendix
VII.
|
The relative shares of the OECD90, REF, ASIA, and ALM regions in the base year
N2O emissions are 39%, 9%, 34%, and 18%, respectively (Figure 5-18). The OECD90
emissions remain quite stable over the 21st century in all the markers, except
A2 in which emissions increase from 2.6 MtN in 1990 to almost 4 MtN in 2100.
Emissions in the ASIA and REF regions increase in the A2 marker, decline in
the B1 marker (after an initial increase in ASIA), and do not change significantly
in the A1 and B2 markers. Finally, the ALM N2O emissions grow quickly in the
A2 marker and remain relatively flat in the other markers. The relatively small
changes in the N2O emissions across regions and scenarios are explained, in
part, by a limited capacity of the SRES models to capture drastic shifts in
technologies and practices (e.g., new catalytic converters or new manure management
systems) that directly impact emission levels.
5.6.1.6. Halocarbons and Other Halogenated Compounds
In 1990, emissions of halocarbons and other halogenated compounds occurred
almost exclusively in the OECD90 region, which contributed 95% to the world
total (Figure 5-19). By 2020, OECD90 still remains a major emitter, but emissions
in ASIA and ALM are increasing at much higher rates. The continued growth of
the production and use of halocarbons and other halogenated compounds in the
developing regions after 2020 makes them primary emitters of these substances
in all the markers, except the B1 marker, in 2100 (Figure 5-19).
The A1B marker has the largest emissions in all the regions in 2050, while
in 2100 the largest emissions across all the regions are produced in the A2
marker. Emissions in all the regions are smallest in the B1 marker, which reflects
its sustainability features (e.g., increased recycling and "dematerialization").
|
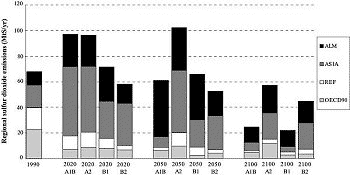
Figure 5-20: Anthropogenic SO2 emissions
in the SRES
marker scenarios by region. The numbers for the additional
two illustrative scenarios for the A1FI and A1T scenario
groups noted
in the Summary for Policymakers can be found
in Appendix
VII.
|
5.6.1.7. Sulfur
As noted in Section 5.5.2.1, even with a comparatively
good agreement on global sulfur emission levels, important uncertainties remain
at the sectoral and regional levels. The base-year uncertainties are especially
important because regional sulfur emissions trends have changed drastically
during the past decade. While declining strongly in the industrialized regions
as a result of sulfur control policies in Europe and North America, and because
of economic reforms in Russia and Eastern Europe, emissions increase rapidly
in Asia with an increase in the energy demand and coal use.
As a general rule, in the SRES scenarios an increasing affluence causes energy
use per capita to rise and leads to the substitution of solid fuels, such as
coal and fuelwood, with energy forms of higher quality. This relationship determines
the sulfur emission dynamics across the SRES markers and regions (Figure 5-20).
In "high income regions" (OECD90, REF) sulfur emissions have already passed
their peaks and are actually declining at present. This trend is expected to
continue in all the markers, except A2 in which an increased use of coal "counters"
a decline in specific emissions in OECD90 (Figure 5-20). Emissions in ASIA grow
in all the markers by 2020, and then decline by 2050, and further decline by
2100. The most dramatic decline is registered in the A1B marker; this is related
to its aggressive assumptions on the introduction of low-sulfur technologies
and fuel switching in the ASIA region (see Box 5-3
for more details). Unlike ASIA, the ALM region sees increases in emissions in
all four markers from 2020 to 2050, because of the somewhat "mixed" nature of
this region, which combines countries with substantially different affluence
levels and development trends. However, by 2100, when low-sulfur technology
becomes widely available everywhere, emissions in the ALM decline in all markers
(Figure 5-20).
|
|
|
|
|
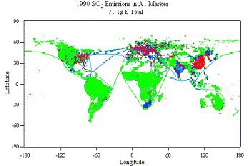
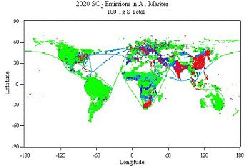
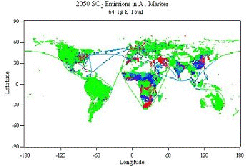
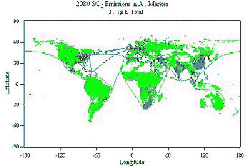
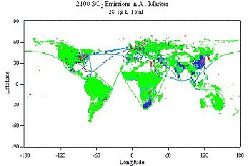
Figure 5-21: Distribution of SO2
emissions in 1990 (top), 2020, 2050, 2080 and in 2100 (bottom) in the A1B
marker scenario. Low emission levels are indicated by shades of (bright)
green; higher levels are indicated by shades of red and pink. |
|
Box 5-5: Gridding of Emission Data
The climate effects of SO2 are intrinsically regional and emissions
on a latitude-longitude grid are required as input to climate models.
Emissions of SO2 were first standardized for four world regions as described
above. Then, emissions from the marker scenarios for six regions (OECD90,
REF, Centrally Planned Asia, Rest of Asia, Latin America, and Africa/Middle
East, scaled to match the standardized emissions) were used for gridding
purposes. For the Annex II countries, a value of 23 MtS was taken for
1990 emissions, a figure derived from a compilation of country-level emissions
inventories (Smith et al., 2000).
These emissions were mapped to a global 1° x 1° emissions grid. For each
region, the pattern of total SO2 emissions from the EDGAR database (Olivier
et al., 1996) was scaled by the total emissions for that region and a
time period. Emissions for OECD90 countries were first scaled individually
to their country-specific values. The value of 3 MtS was added to reflect
international shipping, with the pattern and magnitude of these emissions
held constant.
Emissions of other short-lived gases (CO, NOx , NMVOCs, and CH4) also
needed to be mapped to a global grid for use in atmospheric chemistry
models. The approach taken was essentially the same, with the EDGAR database
used to establish the spatial pattern. Standardization and subsequent
gridding were carried out at the level of the original four world regions,
and no specific adjustments were made for international shipping.
|
5.6.2. Gridded Sulfur Emissions
As discussed above, global sulfur emissions eventually decline in all SRES
scenario families and associated groups. In addition, the regional distribution
of emissions changes drastically over time. While in previous decades major
sulfur emitters were located primarily in industrialized regions of the world,
presently emissions for these sources are declining because of the introduction
of cleaner fuels and the conversion to low-sulfur technologies to comply with
environmental regulations. In the majority of SRES scenarios, this trend is
expected to continue. Meanwhile, less-developed regions are anticipated to experience
strong economic growth associated with an increased demand for energy. Especially
in the short term, fossil fuels are likely to satisfy the major share of this
new demand, which may lead to a steep initial growth in sulfur emissions. As
mentioned earlier (see Section 5.5.2), at some point in
time sulfur emissions will be controlled in all the scenarios and, together
with shifts to essentially sulfur-free energy resources, they will decrease
in the developing regions as they are decreasing now in the industrialized world.
As a consequence of these complex dynamics, different countries and regions
are bound to experience very different levels of sulfur emissions over the 21st
century. To illustrate this, Figure 5-21 shows gridded sulfur emissions in
1990 and 2050 in the A1B marker (see Box 5-5)
|