|
9. Greenhouse Gases and Sulfur Emissions
The SRES scenarios generally cover the full range of GHG and sulfur emissions
consistent with the storylines and the underlying range of driving forces from
studies in the literature, as documented in the SRES database. This section
summarizes the emissions of CO2 ,CH4 , and SO2 . For simplicity, only these
three important gases are presented separately, following the more detailed
exposition in Chapter 5 (see Table
TS-4 for a summary of the ranges of emissions across the scenario groups).
9.1. Carbon Dioxide Emissions
9.1.1. Carbon Dioxide Emissions and Their Driving Forces
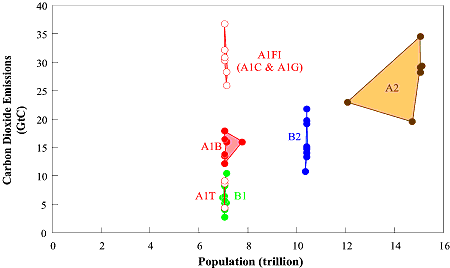
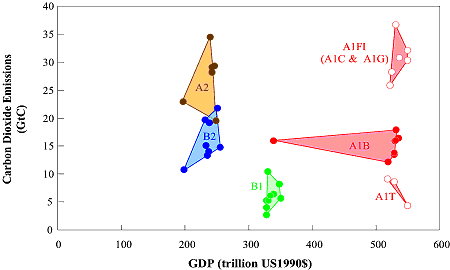
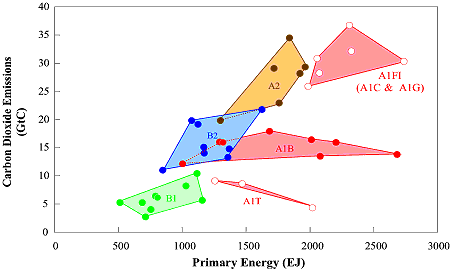
Figure TS-6 illustrates the CO2 emissions across the
SRES scenarios in relation to each of the three main scenario driving forces
- global population, gross world product and primary energy requirements. The
general tendencies across the driving forces are consistent with the underlying
literature. All else being equal, the higher future global populations, higher
gross world product, or higher primary energy requirements would be associated
with higher emissions. However, it is important to note that the range of emissions
is large across the whole range of driving forces considered in SRES, indicating
the magnitude of the uncertainty associated with emission scenarios. For instance,
emissions can range widely for any given level of future population (e.g. between
5 to 20 GtC in case of a low population scenario of seven billion by 2100).
Conversely, emissions in the range of 20 GtC are possible with global population
levels ranging from seven to 15 billion by 2100. While the SRES scenarios do
not map all possibilities, they do indicate general tendencies, with an uncertainty
range consistent with the underlying literature. This emphasizes an important
SRES conclusion: alternative combinations of main scenario driving forces can
lead to similar levels of GHGs emissions by the end of the 21st century. Alternatively,
similar future worlds with respect to socio-economic developments can result
in wide differences in future GHGs emissions, primarily as a result of alternative
technological developments. This suggests that technology is at least as important
a driving force of future GHG emissions as population and economic development
across the set of 40 SRES scenarios.
|

|
Figure TS-6a: Global carbon
dioxide emissions (standardized) across SRES scenarios in relation to global
population in 2100 for the four scenario families and six scenario groups.
A1C and A1G have been combined into one fossil-intensive group A1F1. Shaded
areas indicate scenario space for each scenario family and scenario group
(in A1) (see Chapters 4 and 5). |
 |
Figure TS-6b: Global carbon
dioxide emissions (standardized) across SRES scenarios in relation to gross
world product in 2100 for the four scenario families and six scenario groups.
A1C and A1G have been combined into one fossil-intensive group A1F1. Shaded
areas indicate scenario space for each scenario family and scenario group
(in A1) (see Chapters 4 and 5). |
|

|
Figure TS-6c: Global carbon
dioxide emissions (standardized) across SRES scenarios in relation to global
primary energy requirements in 2100 for the four scenario families and six
scenario groups. A1C and A1G have been combined into one fossil- intensive
group A1F1. Shaded areas indicate scenario space for each scenario family
and scenario group (in A1) (see Chapters 4 and 5). |
9.1.2. Carbon Dioxide Emissions from Energy, Industry, and Land Use
|

(click to enlarge)
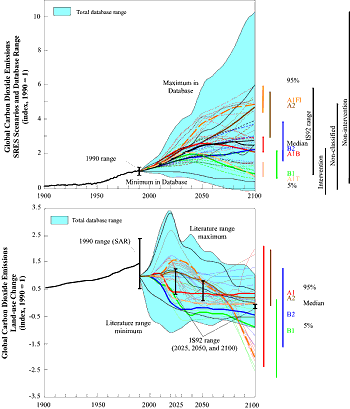
Figure TS-7: Global CO2 emissions
from energy and industry in Figure TS-7a and from land-use change in
Figure TS-7b - historical development from 1900 to 1990 and in 40 SRES
scenarios from 1990 to 2100, shown as an index (1990 = 1). The range
is large in the base year 1990, as indicated by an "error" bar, but
is excluded from the indexed future emissions paths. The dashed time-paths
depict individual SRES scenarios and the blue shaded area the range
of scenarios from the literature (as documented in the SRES database).
The median (50th), 5th, and 95th percentiles of the frequency distribution
are shown. The statistics associated with the distribution of scenarios
do not imply probability of occurrence (e.g., the frequency distribution
of the scenarios in the literature may be influenced by the use of IS92a
as a reference for many subsequent studies). The 40 SRES scenarios are
classified into six groups (that result after A1C and A1G are combined
into one fossil-intensive group A1FI, as in the SPM), which constitute
four scenario families and three A1 scenario groups. Jointly the scenarios
span most of the range of the scenarios in the literature. The emissions
profiles are dynamic, ranging from continuous increases to those that
curve through a maximum and then decline. The colored vertical bars
indicate the range of the four SRES scenario families in 2100. Also
shown as vertical bars on the right of Figure TS-7a are the ranges of
emissions in 2100 of IS92 scenarios and of scenarios from the literature
that apparently include additional climate initiatives (designated as
"intervention" scenarios emissions range), those that do not ("non-intervention"),
and those that cannot be assigned to either of these two categories
("non-classified"). 5
Three vertical bars in Figure TS-7b indicate the range of IS92 land-use
emissions in 2025, 2050, and 2100.
|
Figure TS-7 illustrates the range of CO2 emissions of
the SRES scenarios against the background of all the IS92 scenarios and other
emissions scenarios from the literature documented in the SRES scenario database
(blue shaded area). The range of future emissions is very large so that the
highest scenarios envisage a tenfold increase of global emissions by 2100 while
the lowest have emissions lower than today.
The literature includes scenarios with additional climate initiatives and policies,
which are also referred to as mitigation or intervention scenarios. As shown
in Chapter 2, many ambiguities are associated with the
classification of emissions scenarios into those that include additional climate
initiatives and those that do not. Many cannot be classified in this way on
basis of the information available from the SRES scenario database and the published
literature.
Figure TS-7a indicates the ranges of emissions in 2100
from scenarios that apparently include additional climate initiatives (designated
as "intervention" emissions range), those that do not ("non-intervention"),
and those that cannot be assigned to either of these two categories ("non-classified").
This classification is based on the subjective evaluation of the scenarios in
the database by the members of the writing team and is explained in Section
5 and in Chapter 2 in greater detail. It should be
noted that the distributions of emissions of scenarios from the literature is
asymmetric (see the emissions histogram in Figure 6-5
in Chapter 6) and that the thin tail that extends above
30 GtC by 2100 includes only a few scenarios.
Figure TS-7a shows the ranges of emissions of the four
families (vertical bars next to each of the four marker scenarios), which illustrate
that the scenario groups by themselves cover a large portion of the overall
scenario distribution. Together, they cover much of the range of future emissions,
both with respect to the scenarios in the literature and all SRES scenarios.
Adding all other scenarios increases the covered range. For example, the SRES
scenarios span jointly from the 95th percentile to just above the 5th percentile
of the distribution of energy and industry emissions scenarios from the literature.
This illustrates again that they only exclude the most extreme emissions scenarios
found in the literature that are situated out in the tails of the distribution.
What is perhaps more important is that each of the four scenario families covers
a substantial part of this distribution. This leads to a substantial overlap
in the emissions ranges of the four scenario families. In other words, a similar
quantification of driving forces can lead to a wide range of future emissions
and a given level of future emissions can result from different combinations
of driving forces. This result is of fundamental importance for the assessments
of climate change impacts and possible mitigation and adaptation strategies.
Thus, it warrants some further discussion.
Another interpretation is that a given combination of the main driving forces,
such as the population and economic growth, is not sufficient to determine the
future emissions paths. Different modeling approaches and different specifications
of other scenario assumptions overshadow the influence of the main driving forces.
A particular combination of driving forces, such as specified in the A1 scenario
family, is associated with a whole range of possible emission paths from energy
and industry. The nature of climate change impacts and adaptation and mitigation
strategies would be fundamentally different depending on whether emissions are
high or low, given a particular combination of scenario driving forces. Thus,
the implication is that the whole range needs to be considered in the assessments
of climate change, from high emissions and driving forces to low ones.
The A1 scenario family explored variations in energy systems most explicitly
and hence covers the largest part of the scenario distribution shown in Figure
TS-7a, from the 95 th to just above the 10th percentile. The A1 scenario
family includes four groups of scenarios that explore different structures of
future energy systems, from carbon-intensive development paths to high rates
of decarbonization. Two of the fossil-intensive groups were merged into one
group, as in SPM, resulting in three A1 groups. All A1 groups otherwise share
the same assumptions about the main driving forces (see Chapter
6 and for further detail Chapters 4 and 5).
This indicates that different structures of the energy system can lead to basically
the same variation in future emissions as generated by different combinations
of the other main driving forces - population, economic activities, and energy
consumption levels. The implication is that decarbonization of energy systems
- the shift from carbon-intensive to less carbon-intensive and carbon-free sources
of energy - is of similar importance in determining the future emissions paths
as other driving forces. Sustained decarbonization requires the development
and successful diffusion of new technologies. Thus investments in new technologies
during the coming decades might have the same order of influence on future emissions
as population growth, economic development, and levels of energy consumption
taken together.
Figure TS-7b shows that CO2 emissions from deforestation
peak in many SRES scenarios after several decades and subsequently gradually
decline. This pattern is consistent with many scenarios in the literature and
can be associated with slowing population growth and increasing agricultural
productivity. These allow a reversal of current deforestation trends, leading
to eventual CO2 sequestration. Emissions decline fastest in the B1 family. Only
in the A2 family do net anthropogenic CO2 emissions from land use remain positive
through to 2100. As was the case for energy-related emissions, CO2 emissions
related to land-use in the A1 family cover the widest range. The range of land-use
emissions across the IS92 scenarios is narrower in comparison.
|