F.2 Projections of Future Changes in Greenhouse Gases and Aerosols

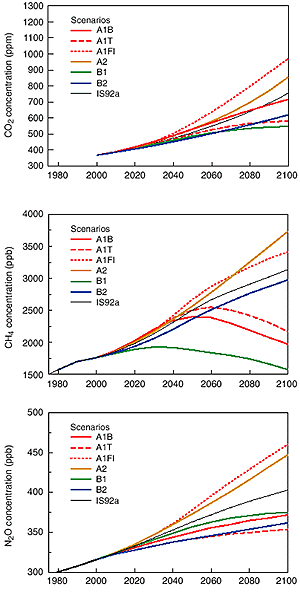
Figure 18: Atmospheric concentrations of CO2, CH4
and N2O resulting from the six SRES scenarios and from the IS92a
scenario computed with current methodology. [Based on Figures
3.12 and 4.14] |
Models indicate that the illustrative SRES scenarios lead to very different
CO2 concentration trajectories (see Figure
18). By 2100, carbon cycle models project atmospheric CO2 concentrations
of 540 to 970 ppm for the illustrative SRES scenarios (90 to 250% above the concentration
of 280 ppm in 1750). The net effect of land and ocean climate feedbacks as indicated
by models is to further increase projected atmospheric CO2 concentrations
by reducing both the ocean and land uptake of CO2. These projections
include the land and ocean climate feedbacks. Uncertainties, especially about
the magnitude of the climate feedback from the terrestrial biosphere, cause a
variation of about -10 to +30% around each scenario. The total range is 490 to
1260 ppm (75 to 350% above the 1750 concentration).
Measures to enhance carbon storage in terrestrial ecosystems could influence
atmospheric CO2 concentration, but the upper bound for reduction
of CO2 concentration by such means is 40 to 70 ppm. If all the
carbon released by historic land-use changes could be restored to the terrestrial
biosphere over the course of the century (e.g., by reforestation), CO2
concentration would be reduced by 40 to 70 ppm. Thus, fossil fuel CO2
emissions are virtually certain to remain the dominant control over trends in
atmospheric CO2 concentration during this century.
Model calculations of the abundances of the primary non-CO2 greenhouse
gases by the year 2100 vary considerably across the six illustrative SRES scenarios.
In general A1B, A1T
and B1 have the smallest increases, and A1FI
and A2, the largest. The CH4 changes
from 1998 to 2100 range from -190 to +1970 ppb (-11 to +112%), and N2O
increases from +38 to +144 ppb (+12 to +46%) (see Figures
17b and c). The HFCs (134a, 143a, and
125) reach abundances of a few hundred to a thousand ppt from negligible levels
today. The PFC CF4 is projected to increase to 200 to 400 ppt, and SF6
is projected to increase to 35 to 65 ppt.
For the six illustrative SRES emissions scenarios, projected emissions of
indirect greenhouse gases (NOx, CO, VOC), together with changes in
CH4, are projected to change the global mean abundance of the tropospheric
hydroxyl radical (OH), by -20% to +6% over the next century. Because of
the importance of OH in tropospheric chemistry, comparable, but opposite sign,
changes occur in the atmospheric lifetimes of the greenhouse gases CH4
and HFCs. This impact depends in large part on the magnitude of and the balance
between NOx and CO emissions. Changes in tropospheric O3
of –12 to +62% are calculated from 2000 until 2100. The largest increase predicted
for the 21st century is for scenarios A1FI and
A2 and would be more than twice as large as that
experienced since the Pre-industrial Era. These O3 increases are
attributable to the concurrent and large increases in anthropogenic NOx
and CH4 emissions.
The large growth in emissions of greenhouse gases and other pollutants as
projected in some of the six illustrative SRES scenarios for the 21st century
will degrade the global environment in ways beyond climate change. Changes
projected in the SRES A2 and A1FI
scenarios would degrade air quality over much of the globe by increasing background
levels of tropospheric O3. In northern mid-latitudes during summer,
the zonal average of O3 increases near the surface are about 30 ppb
or more, raising background levels to about 80 ppb, threatening the attainment
of current air quality standards over most metropolitan and even rural regions
and compromising crop and forest productivity. This problem reaches across continental
boundaries and couples emissions of NOx on a hemispheric scale.

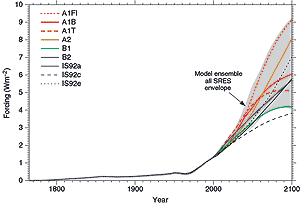
Figure 19: Simple model results: estimated historical anthropogenic
radiative forcing up to the year 2000 followed by radiative forcing for
the six illustrative SRES scenarios. The shading shows the envelope of forcing
that encompasses the full set of thirty five SRES scenarios. The method
of calculation closely follows that explained in the chapters. The values
are based on the radiative forcing for a doubling of CO2 from
seven AOGCMs. The IS92a, IS92c, and IS92e forcing is also shown following
the same method of calculation. [Based on Figure
9.13a] |
Except for sulphate and black carbon, models show an approximately linear
dependence of the abundance of aerosols on emissions. The processes that
determine the removal rate for black carbon differ substantially between the
models, leading to major uncertainty in the future projections of black carbon.
Emissions of natural aerosols such as sea salt, dust, and gas phase precursors
of aerosols such as terpenes, sulphur dioxide (SO2), and dimethyl
sulphide oxidation may increase as a result of changes in climate and atmospheric
chemistry.
The six illustrative SRES scenarios cover nearly the full range of forcing
that results from the full set of SRES scenarios. Estimated total historical
anthropogenic radiative forcing from 1765 to 1990 followed by forcing resulting
from the six SRES scenarios are shown in Figure 19.
The forcing from the full range of 35 SRES scenarios is shown on the figure
as a shaded envelope, since the forcings resulting from individual scenarios
cross with time. The direct forcing from biomass-burning aerosols is scaled
with deforestation rates. The SRES scenarios include the possibility of either
increases or decreases in anthropogenic aerosols (e.g., sulphate aerosols, biomass
aerosols, and black and organic carbon aerosols), depending on the extent of
fossil fuel use and policies to abate polluting emissions. The SRES scenarios
do not include emissions estimates for non-sulphate aerosols. Two methods for
projecting these emissions were considered in this report: the first scales
the emissions of fossil fuel and biomass aerosols with CO while the second scales
the emissions with SO2 and deforestation. Only the second method
was used for climate projections. For comparison, radiative forcing is also
shown for the IS92a scenario. It is evident that the range for the new SRES
scenarios is shifted higher compared to the IS92 scenarios. This is mainly due
to the reduced future SO2 emissions of the SRES scenarios compared
to the IS92 scenarios, but also to the slightly larger cumulative carbon emissions
featured in some SRES scenarios.
In almost all SRES scenarios, the radiative forcing due to CO2,
CH4, N2O and tropospheric O3 continue to increase,
with the fraction of the total radiative forcing due to CO2 projected
to increase from slightly more than half to about three-quarters of the total.
The radiative forcing due to O3-depleting gases decreases due to the
introduction of emission controls aimed at curbing stratospheric ozone depletion.
The direct aerosol (sulphate and black and organic carbon components taken together)
radiative forcing (evaluated relative to present day, 2000) varies in sign for
the different scenarios. The direct plus indirect aerosol effects are projected
to be smaller in magnitude than that of CO2. No estimates are made
for the spatial aspects of the future forcings. The indirect effect of aerosols
on clouds is included in simple climate model calculations and scaled non-linearly
with SO2 emissions, assuming a present day value of –0.8 Wm-2,
as in the SAR.
|

