9.3.4.2 The role of climate sensitivity and ocean heat uptake
Earlier (Section 9.3.1), it was noted that the climate
response varies from model to model even when the radiative forcing used to
drive the models is similar. This difference in the climate modelsí response
is mainly the result of differing climate sensitivities and differing rates
of heat uptake by the oceans in each model, although differences in the AOGCM
radiative forcing for a given CO2 concentration also have a small
effect (see Chapter 6, Section 6.3).
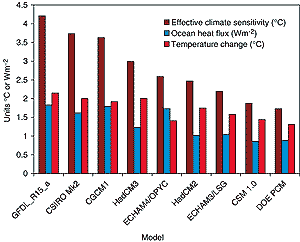
The effective climate sensitivity and ocean heat uptake are compared by Raper
et al. (2001b) using the CMIP2 data set (1%/yr CO2 increase to doubling).
The effective climate sensitivities around the time of CO2 doubling
(average for the years 61 to 80), when the signal is strongest, agree reasonably
well with the mixed-layer equilibrium climate sensitivities given in Figure
9.20. Results are shown for various models in Figure 9.20
It is evident that the models with high effective climate sensitivity also tend
to have a large net heat flux into the ocean. This oceanic heat flux causes
a delay in the climate response. The relationship between the effective climate
sensitivity and the oceanic heat uptake was first described by Hansen et al.
(1984, 1985) using a box diffusion model. Raper et al. (2001b) show that an
additional ocean-feedback is possibly associated with the warming and freshening
of the high latitude surface waters that enhances this relationship. Details
of the individual modelís sub-grid scale parametrizations also affect both
the effective climate sensitivity and the oceanic heat uptake (Weaver and Wiebe,
1999). The evident relationship between effective climate sensitivity and ocean
heat uptake leads to the transient climate response (TCR) having a smaller spread
among the model results than the climate modelsí climate sensitivity alone
would suggest (see Section 9.3.1). Since the oceanic
heat uptake is directly related to the thermal expansion, the range for thermal
expansion is correspondingly increased due to the compensation noted above (see
Chapter 11 for a complete discussion of sea level rise).
|

Figure 9.20: Comparison of CMIP2 model results for 20-year average
values centred on year 70, the time of CO2 doubling. Values
are shown for the effective climate sensitivity, the net heat flux across
the ocean surface multiplied by the ocean fraction and the global mean
temperature change (TCR).
|
|