10.3.2 Simulations of Climate Change
10.3.2.1 Mean climate
Giorgi and Francisco (2000b) analysed regional temperature change in five AOGCMs
under a range of forcing scenarios. In all regions warming depended strongly
on the forcing scenario used and inter-model differences in simulated warming
were large compared to differences between ensemble members from a single model.
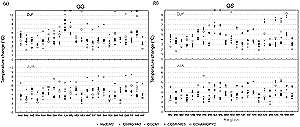
Figure 10.3a presents some results from Giorgi and Francisco
(2000b) relative to scenarios of 1%/yr increase in GHG concentration without
sulphate aerosol effects. Most regional warmings for 2071 to 2100 compared to
1961 to 1990 are in the range of 2 to 8°C. Exceptions are the high northern
latitudes in DJF (5 to 11°C in GRL, NAS and ALA) and central and eastern
Asia in DJF (3 to 11°C in EAS, CAS and TIB). In many regions, the warming
is 2 to 3°C higher in the CCC simulation than in the other models (e.g.,
in the African regions of WAF, EAF, SAF and SAH). Giorgi and Francisco (2000b)
also considered corresponding simulations in which large increases in sulphate
aerosols (consistent with IS92a emission scenarios) were included in addition
to the GHG changes and found significantly reduced regional warming (the range
for most regions is 1.5 to 7°C) (Figure 10.3b). Nearly
all the temperature changes in Figure10.3a were statistically
significant at the 5% confidence level (Giorgi and Francisco, 2000b).
Inter-model differences in regional warming partially reflect differences in
the global climate sensitivities of the models concerned. This effect may be
set aside by comparing the regional warmings given in Giorgi and Francisco (2000b)
with the corresponding global average warmings of the simulations used (Figure
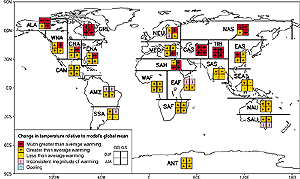
10.4). Nearly all land areas warm more rapidly than the global average,
particularly those at high latitudes in the cold season. For both the non-sulphate
and sulphate cases, in the northern high latitudes, central Asia and Tibet (ALA,
GRL, NAS, CAS and TIB) in DJF and in northern Canada, Greenland and central
Asia and Tibet (GRL, CAS and TIB) in JJA, the warming is in excess of 40% above
the global average. In both cases, warming is less than the global average in
South and Southeast Asia, and southern South America (SAS, SEA and SSA) in JJA.
In this analysis, differences between the non-sulphate and sulphate cases are
minor. A strong contribution to the enhancement of warming over cold climate
regions is given by the snow and sea ice albedo feedback mechanism (Giorgi and
Francisco, 2000b). The snow albedo feedback also tends to enhance warming over
high elevation regions (Fyfe and Flato, 1999).

Figure 10.3: Simulated temperature changes in °C (mean
for 2071 to 2100 minus 1990) conditions of 1%/yr increasing CO2
without and with sulphate forcing using experiments undertaken with
the AOGCMs of CSIRO Mk2, CCSR/NIES, ECHAM/OPYC, CGCM1 and Hadley Centre
(further experimental details are in Table
9.1). Under both forcing scenarios a four-member ensemble is included
of the Hadley Centre model, and under the CO2 plus sulphate
scenario a three-member ensemble is included for the CGCM1 model.
(a) increased CO2 only (GG), (b) increased CO2
and sulphate aerosols (GS). Global model warming values in the CO2
increase-only experiments are 3.07°C for HadCM2 (ensemble average),
3.06°C for CSIRO Mk2, 4.91°C for CGCM1, 3.00°C for CCSR/NIES
and 3.02°C for ECHAM/OPYC. Global model warming values for the
experiments including sulphate forcing are 2.52°C for HadCM2 (ensemble
average), 2.72°C for CSIRO Mk2, 3.80°C for CGCM1 (ensemble
average) and 2.64°C for CCSR/NIES (from Giorgi and Francisco,
2000b). |
|

Figure 10.4: Analysis of inter-model consistency in regional
warming relative to each model’s global warming, based on the
results presented in Figure 10.3. Regions are
classified as showing either agreement on warming in excess of 40%
above the global average (“Much greater than average warming”),
agreement on warming greater than the global average (“Greater
than average warming”), agreement on warming less than the global
average (“Less than average warming”), or disagreement amongst
models on the magnitude of regional relative warming (“Inconsistent
magnitude of warming”). There is also a category for agreement
on cooling (which is not used). GG is the greenhouse gas only case
(see Figure 10.3a), and, GS, the greenhouse
gas with increased sulphate case (see Figure 10.3b).
In constructing the figure, ensemble results were averaged to a single
case, and “agreement” was defined as having at least four
of the five GG models agreeing or three of the four GS models agreeing.
The global annual average warming of the models used span 3.0 to 4.9°C
for GG and 2.5 to 3.8°C for GS, and therefore a regional 40% amplification
represents warming ranges of 4.2 to 6.9°C for GG and 3.5 to 5.3°C
for GS. |
|
In line with the globally averaged precipitation increase given by all models
(see Chapter 9), precipitation is also simulated to increase
regionally in the majority of cases. However, regions of precipitation decrease
are also simulated. Precipitation reduction can be due to changes in large and
synoptic scale features (e.g., changes in storm track characteristics) and/or
to local feedback processes (e.g., between soil moisture and precipitation).
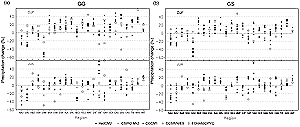
The results of the regional analysis of Giorgi and Francisco (2000b) are presented
in Figure 10.5 (as percentage changes for each model,
region and forcing scenario) and are used in an analysis of inter-model consistency
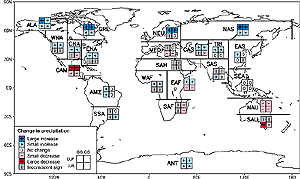
which is presented in Figure 10.6. In both the non-sulphate
and sulphate cases for DJF, most simulations show increased precipitation for
regions in the mid- to high latitudes of the Northern Hemisphere (ALA, GRL,
WNA, ENA, CNA, NEU, NAS, CAS and TIB) and over Antarctica (ANT). In the tropics,
models consistently show increase in Africa (EAF and WAF), increase or little
change in South America (AMZ) and little change in Southeast Asia (SEA). Simulated
regional precipitation decreases are common in sub-tropical latitudes, but only
for central America (CAM) and northern Australia (NAU) are decreases indicated
by most models in both cases. The pattern is broadly similar in JJA, although
with some features shifting northwards. Only the high-latitude regions (ANT,
ALA, GRL and NAS) show consistent increase. There is disagreement on the direction
of change in a number of regions in the northern mid-latitudes and the sub-tropics,
although consistent decrease is evident in the Mediterranean Basin (MED) and
central American (CAM) regions. Some regions along the Inter-Tropical Convergence
Zone (ITCZ) show consistent increase or little change (AMZ , SEA and SAS), but
eastern Africa (EAF) shows a consistent decrease. In the Southern Hemisphere,
only Australia (SAU and NAU) shows a consistent pattern of change in both cases
(decrease). When the non-sulphate and sulphate cases are contrasted, more frequent
simulated precipitation decrease may be noted in parts of North America, Africa
and Asia for the case with increased sulphate aerosols (see results in Figure
10.6 for SAF, CNA, CAS and EAS).

Figure 10.5: As Figure 10.3, but for
percentage precipitation change (from Giorgi and Francisco, 2000b). |
|

Figure 10.6: Analysis of inter-model consistency in regional
precipitation change based on the results presented in Figure
10.5. Regions are classified as showing either agreement on increase
with an average change of greater than 20% (“Large increase”),
agreement on increase with an average change between 5 and 20% (“Small
increase”), agreement on a change between –5 and +5% or
agreement with an average change between –5 and 5% (“No
change”), agreement on decrease with an average change between
–5 and -20% (“Small decrease”), agreement on decrease
with an average change of less than -20% (“Large decrease”),
or disagreement (“Inconsistent sign”). GG is the greenhouse
gas only case (see Figure 10.5a), and, GS, the greenhouse gas with
increased sulphate case (see Figure 10.5b).
In constructing the figure, ensemble results were averaged to a single
case, and “agreement” was defined as having at least of
four the five GG models agreeing or three of the four GS models agreeing. |
|
The magnitude of regional precipitation change varies considerably amongst
models, with the typical range being around 0 to 50% where the direction of
change is strongly indicated and around -30 to +30% where it is not. Larger
ranges occur in some regions (e.g., -30 to +60% in southern Africa in JJA for
GHG only forcing), but this occurs mainly in regions of low seasonal precipitation
where the implied range in absolute terms would not be large. Changes are consistently
large (greater than 20% averaged across models) in both the sulphate and non-sulphate
cases in northern high latitude regions (GRL, NEU and NAS, positive change)
in DJF and central America (CAM, negative change) in DJF. The number of precipitation
changes statistically significant at the 5% confidence level varied widely across
regions and seasons.
Continues on next page
|