11.2.4 Interaction of Ice Sheets, Sea Level and the Solid Earth
11.2.4.1 Eustasy, isostasy and glacial-interglacial cycles
On time-scales of 103 to 105 years, the most important processes affecting
sea level are those associated with the growth and decay of the ice sheets through
glacial-interglacial cycles. These contributions include the effect of changes
in ocean volume and the response of the earth to these changes. The latter are
the glacio-hydro-isostatic effects: the vertical land movements induced by varying
surface loads of ice and water and by the concomitant redistribution of mass
within the Earth and oceans. While major melting of the ice sheets ceased by
about 6,000 years ago, the isostatic movements remain and will continue into
the future because the Earth’s viscous response to the load has a time-constant
of thousands of years. Observational evidence indicates a complex spatial and
temporal pattern of the resulting isostatic sea level change for the past 20,000
years. As the geological record is incomplete for most parts of the world, models
(constrained by the reliable sea level observations) are required to describe
and predict the vertical land movements and changes in ocean area and volume.
Relative sea level changes caused by lithospheric processes, associated for
example with tectonics and mantle convection, are discussed in Section
11.2.6.
Figure 11.4 illustrates global-average sea level
change over the last 140,000 years. This is a composite record based on oxygen
isotope data from Shackleton (1987) and Linsley (1996), constrained by the Huon
terrace age-height relationships of Chappell et al. (1996a), the estimate of
the LGM sea level by Yokoyama et al. (2000), the late-glacial eustatic sea level
function of Fleming et al. (1998), and the timing of the Last Interglacial by
Stirling et al. (1998). These fluctuations demonstrate the occurrence of sea
level oscillations during a glacial-interglacial cycle that exceed 100 m in
magnitude at average rates of up to 10 mm/year and more during periods of decay
of the ice sheets and sometimes reaching rates as high as 40 mm/year (Bard et
al., 1996) for periods of very rapid ice sheet decay. Current best estimates
indicate that the total LGM land-based ice volume exceeded present ice volume
by 50 to 53x106 km3 (Yokoyama et al., 2000).
Local sea level changes can depart significantly from this average signal because
of the isostatic effects. Figure 11.5 illustrates
typical observational results for sea level change since the LGM in regions
with no significant land movements other than of a glacio-hydro-isostatic nature.
Also shown are model predictions for these localities, illustrating the importance
of the isostatic effects. Geophysical models of these isostatic effects are
well developed (see reviews by Lambeck and Johnston, 1998; Peltier, 1998). Recent
modelling advances have been the development of high-resolution models of the
spatial variability of the change including the detailed description of ice
loads and of the melt-water load distribution (Mitrovica and Peltier, 1991;
Johnston, 1993) and the examination of different assumptions about the physics
of the earth (Peltier and Jiang, 1996; Johnston et al., 1997; Kaufmann and Wolf,
1999; Tromp and Mitrovica, 1999).
|
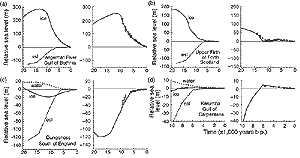
Figure 11.5: Examples of observed relative sea level change (with
error bars, right-hand side) and model predictions for four different
locations. The model predictions (left-hand side) are for the glacio-hydro-eustatic
contributions to the total change (solid line, right hand side). (a) Angermann
River, Sweden, near the centre of the former ice sheet over Scandinavia.
The principal contribution to the sea level change is the crustal rebound
from the ice unloading (curve marked ice, left-hand side) and from the
change in ocean volume due to the melting of all Late Pleistocene ice
sheets (curve marked esl). The combined predicted effect, including a
small water loading term (not shown), is shown by the solid line (right-hand
side), together with the observed values. (b) A location near Stirling,
Scotland. Here the ice and esl contributions are of comparable magnitude
but opposite sign (left-hand side) such that the rate of change of the
total contribution changes sign (right-hand side). This result is typical
for locations near former ice margins or from near the centres of small
ice sheets. (c) The south of England where the isostatic contributions
from the water (curve marked water) and ice loads are of similar amplitude
but opposite sign. The dominant contribution to sea level change is now
the eustatic contribution. This behaviour is characteristic of localities
that lie well beyond the ice margins where a peripheral bulge created
by the ice load is subsiding as mantle material flows towards the region
formerly beneath the ice. (d) A location in Australia where the melt-water
load is the dominant cause of isostatic adjustment. Here sea level has
been falling for the past 6,000 years. This result is characteristic of
continental margin sites far from the former areas of glaciation. (From
Lambeck, 1996.)
|
Information about the changes in ice sheets come from field observations, glaciological
modelling, and from the sea level observations themselves. Much of the emphasis
of recent work on glacial rebound has focused on improved calculations of ice
sheet parameters from sea level data (Peltier, 1998; Johnston and Lambeck, 2000;
see also Section 11.3.1) but discrepancies between
glaciologically-based ice sheet models and models inferred from rebound data
remain, particularly for the time of, and before, the LGM. The majority of ice
at this time was contained in the ice sheets of Laurentia and Fennoscandia but
their combined estimated volume inferred from the rebound data for these regions
(e.g., Nakada and Lambeck, 1988; Tushingham and Peltier, 1991, 1992; Lambeck
et al., 1998) is less than the total volume required to explain the sea level
change of about 120 to 125 m recorded at low latitude sites (Fairbanks, 1989;
Yokoyama et al., 2000). It is currently uncertain how the remainder of the ice
was distributed. For instance, estimates of the contribution of Antarctic ice
to sea level rise since the time of the LGM range from as much as 37 m (Nakada
and Lambeck, 1988) to 6 to 13 m (Bentley, 1999; Huybrechts and Le Meur, 1999).
Rebound evidence from the coast of Antarctica indicates that ice volumes have
changed substantially since the LGM (Zwartz et al., 1997; Bentley, 1999) but
these observations, mostly extending back only to 8,000 years ago, do not provide
good constraints on the LGM volumes. New evidence from exposure age dating of
moraines and rock surfaces is beginning to provide new constraints on ice thickness
in Antarctica (e.g., Stone et al., 1998) but the evidence is not yet sufficient
to constrain past volumes of the entire ice sheet.
|