|
4.6. Insurance and Other Financial Services
The financial services sector—broadly defined as private and public institutions
that offer insurance and disaster relief, banking, and asset management services—is
a unique indicator of potential socioeconomic impacts of climate change because
it is sensitive to climate change and it integrates effects on other sectors.
The sector is a key agent of adaptation (e.g., through support of building codes
and, to a limited extent, land-use planning), and financial services represent
risk-spreading mechanisms through which the costs of weather-related events
are distributed among other sectors and throughout society. However, insurance,
whether provided by public or private entities, also can encourage complacency
and maladaptation by fostering development in at-risk areas such as U.S. floodplains
or coastal zones. The effects of climate change on the financial services sector
are likely to manifest primarily through changes in spatial distribution, frequencies,
and intensities of extreme weather events (Table TS-4).
[8.1, 8.2, 15.2.7]
| Table TS-4: Extreme climate-related phenomena and
their effects on the insurance industry: observed changes and projected
changes during 21st century (after Table 3-10;
see also Table 8-1). |
 |
| Changes in Extreme Climate Phenomena |
Observed Changes
|
Projected Changes
|
Type of Event Relevant to Insurance Sector
|
Relevant Time Scale
|
Sensitive Sectors/Activities
|
Sensitive Insurance Branches
|
Likelihood
|
|
| Temperature Extremes |
|
|
|
|
|
|
| Higher maximum temperatures, more hot days and
heat wavesb over nearly all land areas |
Likelya (mixed trends for heat waves
in several regions)
|
Very likelya
|
Heat wave |
Daily-weekly maximum |
Electric reliability, human settlements |
Health, life, property, business interruption |
|
| Heat wave, droughts |
Monthly-seasonal maximum |
Forests (tree health), natural resources, agriculture, water
resources, electricity demand and reliability, industry, health, tourism
|
Health, crop, business interruption |
|
| Higher (increasing) minimum temperatures, fewer cold days,
frost days, and cold wavesb over nearly all land areas |
Very likelya (cold waves not treated
by WGI)
|
Very likelya
|
Frost, frost heave |
Daily-monthly minimum |
Agriculture, energy demand, health, transport, human settlements
|
Health, crop, property, business interruption, vehicle |
|
| Rainfall/Precipitation Extremes |
|
|
|
|
| cold wavesb over nearly all land areas
More intense precipitation events |
Likelya over many Northern Hemisphere
mid- to high-latitude land areas
|
Very likelya over many areas
|
Flash flood |
Hourly-daily maximum |
Human settlements |
Property, flood, vehicle, business interruption, life, health |
| |
|
|
|
| |
|
|
Flood, inundation, mudslide |
Weekly-monthly maximum |
Agriculture, forests, transport, water quality, human settlements,
tourism |
Property, flood, crop, marine, business interruption |
|
| Increased summer drying and associated risk of drought |
Likelya in a few areas
|
Likelya over most mid-latitude continental
interiors (lack of consistent projections in other areas)
|
Summer drought, land subsidence, wildfire |
Monthly-seasonal minimum |
Forests (tree health), natural resources, agriculture, water
resources, (hydro)energy supply, human settlements |
Crop, property, health |
|
| Increased intensity of mid-latitude stormsc |
Medium likelihooda of increase in
Northern Hemisphere, decrease in Southern Hemisphere
|
Little agreement among current models
|
Snowstorm, ice storm, avalanche |
Hourly-weekly |
Forests, agriculture, energy distribution and reliability,
human settlements, mortality, tourism |
Property, crop, vehicle, aviation, life, business interruption |
| |
|
|
|
| |
|
|
Hailstorm |
Hourly |
Agriculture, property |
Crop, vehicle, property, aviation |
|
| Intensified droughts and floods associated with El Niño
events in many different regions (see also droughts and extreme precipitation
events) |
Inconclusive information
|
Likelya
|
Drought and floods |
Various |
Forests (tree health), natural resources, agriculture, water
resources, (hydro)energy supply, human settlements |
Property, flood, vehicle, crop, marine, business interruption,
life, health |
|
| Wind Extremes |
|
|
|
|
|
|
| Increased intensity of mid-latitude stormsb |
No compelling evidence for change
|
Little agreement among current models
|
Mid-latitude windstorm |
Hourly-daily |
Forests, electricity distribution and reliability, human
settlements |
Property, vehicle, aviation, marine, business interruption,
life |
| |
|
|
|
| |
|
|
Tornadoes |
Hourly |
Forests, electricity distribution and reliability, human
settlements |
Property, vehicle, aviation, marine, business interruption |
|
| Increase in tropical cyclone peak wind intensities, mean
and peak precipitation intensitiesc |
Wind extremes not observed in the few analyses available;
insufficient data for precipitation
|
Likelya over some areas
|
Tropical storms, including cyclones, hurricanes, and typhoons |
Hourly-weekly |
Forests, electricity distribution and reliability, human
settlements, agriculture |
Property, vehicle, aviation, marine, business interruption,
life |
|
| Other Extremes |
|
|
|
|
|
|
| Refer to entries above for higher temperatures, increased
tropical and mid-latitude storms |
Refer to relevant entries above
|
Refer to relevant entries above
|
Lightning |
Instant-aneous |
Electricity distribution and reliability, human settlements,
wildfire |
Life, property, vehicle, aviation, marine, business interruption |
|
| Refer to entries above for increased tropical cyclones, Asian
summer monsoon, and intensity of mid-latitude storms |
Refer to relevant entries above
|
Refer to relevant entries above
|
Tidal surge (associated with onshore gales), coastal inundation |
Daily |
Coastal zone infrastructure, agriculture and industry, tourism |
Life, marine, property, crop |
|
| Increased Asian summer monsoon precipitation variability |
Not treated by WGI
|
Likelya
|
Flood and drought |
Seasonal |
Agriculture, human settlements |
Crop, property, health, life |
|
The costs of extreme weather events have exhibited a rapid upward trend
in recent decades. Yearly global economic losses from large events increased
from US$3.9 billion yr-1 in the 1950s to US$40 billion yr-1
in the 1990s (all 1999 US$, uncorrected for purchasing power parity). Approximately
one-quarter of the losses occurred in developing countries. The insured portion
of these losses rose from a negligible level to US$9.2 billion annually during
the same period. Including events of all sizes doubles these loss totals (see
Figure TS-5). The costs of weather events have risen rapidly,
despite significant and increasing efforts at fortifying infrastructure and
enhancing disaster preparedness. These efforts dampen to an unknown degree the
observed rise in loss costs, although the literature attempting to separate
natural from human driving forces has not quantified this effect. As a measure
of increasing insurance industry vulnerability, the ratio of global property/casualty
insurance premiums to weather-related losses—an important indicator of
adaptive capacity—fell by a factor of three between 1985 and 1999. [8.3]
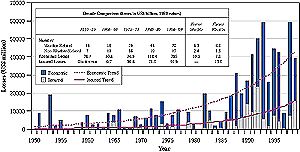
Figure TS-5: The costs of catastrophic weather events have exhibited
a rapid upward trend in recent decades. Yearly economic losses from large
events increased 10.3-fold from US$4 billion yr-1 in the 1950s
to US$40 billion yr-1 in the 1990s (all in 1999 US$). The insured
portion of these losses rose from a negligible level to US$9.2 billion annually
during the same period, and the ratio of premiums to catastrophe losses
fell by two-thirds. Notably, costs are larger by a factor of 2 when losses
from ordinary, noncatastrophic weather-related events are included. The
numbers generally include "captive" self-insurers but not the
less-formal types of self-insurance. |
Part of the observed upward trend in historical disaster
losses is linked to socioeconomic factors—such as population growth, increased
wealth, and urbanization in vulnerable areas—and part is linked to climatic
factors such as observed changes in precipitation, flooding, and drought events.
Precise attribution is complex, and there are differences in the balance of
these two causes by region and by type of event. Many of the observed trends
in weather-related losses are consistent with what would be expected under climate
change. Notably, the growth rate in human-induced and non-weather-related losses
has been far lower than that of weather-related events. [8.2.2]
Recent history has shown that weather-related losses can stress insurance
companies to the point of impaired profitability, consumer price increases,
withdrawal of coverage, and elevated demand for publicly funded compensation
and relief. Increased uncertainty will increase the vulnerability of the
insurance and government sectors and complicate adaptation and disaster relief
efforts under climate change. [8.3, 15.2.7]
The financial services sector as a whole is expected to be able to cope
with the impacts of future climate change, although the historic record shows
that low-probability, high-impact events or multiple closely spaced events severely
affect parts of the sector, especially if adaptive capacity happens to be
simultaneously depleted by nonclimate factors (e.g., adverse market conditions
that can deplete insurer loss reserves by eroding the value of securities and
other insurer assets). There is high confidence that climate change and anticipated
changes in weather-related events that are perceived to be linked to climate
change would increase actuarial uncertainty in risk assessment and thus in the
functioning of insurance markets. Such developments would place upward pressure
on premiums and/or could cause certain risks to be reclassified as uninsurable,
with subsequent withdrawal of coverage. This, in turn, would place increased
pressure on government-based insurance and relief systems, which already are
showing strain in many regions and are attempting to limit their exposures (e.g.,
by raising deductibles and/or placing caps on maximum claims payable).
Trends toward increasing firm size, diversification, and integration of insurance
with other financial services, as well as improved tools to transfer risk, all
potentially contribute to robustness. However, the property/casualty insurance
and reinsurance segments have greater sensitivity, and individual companies
already have experienced catastrophe-related bankruptcies triggered by weather
events. Under some conditions and in some regions, the banking industry as a
provider of loans also may be vulnerable to climate change. In many cases, however,
the banking sector transfers risk back to insurers, who often purchase their
debt products. [8.3, 8.4, 15.2.7]
Adaptation2
to climate change presents complex challenges, as well as opportunities, for
the financial services sector. Regulatory involvement in pricing, tax treatment
of reserves, and the (in)ability of firms to withdraw from at-risk markets are
examples of factors that influence the resilience of the sector. Management
of climate-related risk varies by country and region. Usually it is a mixture
of commercial and public arrangements and self-insurance. In the face of climate
change, the relative role of each can be expected to change. Some potential
response options offer co-benefits that support sustainable development and
climate change mitigation objectives (e.g., energy-efficiency measures that
also make buildings more resilient to natural disasters, in addition to helping
the sector adapt to climate changes). [8.3.4, 8.4.2]
The effects of climate change are expected to be greatest in developing countries
(especially those that rely on primary production as a major source of income)
in terms of loss of life, effects on investment, and effects on the economy.
Damages from natural disasters have been as high as half of the gross domestic
product (GDP) in one case. Weather disasters set back development, particularly
when funds are redirected from development projects to disaster-recovery efforts.
[8.5]
Equity issues and development constraints would arise if weather-related risks
become uninsurable, insurance prices increase, or the availability of insurance
or financing becomes limited. Thus, increased uncertainty could constrain development.
Conversely, more extensive penetration of or access to insurance and disaster
preparedness/recovery resources would increase the ability of developing countries
to adapt to climate change. More widespread introduction of microfinancing schemes
and development banking also could be an effective mechanism to help developing
countries and communities adapt. [8.3]
This assessment of financial services has identified some areas of improved
knowledge and has corroborated and further augmented conclusions reached in
the SAR. It also has highlighted many areas where greater understanding is needed—
in particular, better analysis of economic losses to determine their causation,
assessment of financial resources involved in dealing with climate change damage
and adaptation, evaluation of alternative methods to generate such resources,
deeper investigation of the sector's vulnerability and resilience to a range
of extreme weather event scenarios, and more research into how the sector (private
and public elements) could innovate to meet the potential increase in demand
for adaptation funding in developed and developing countries, to spread and
reduce risks from climate change. [8.7]
|