10.3 Projected Changes in the Physical Climate System
The context for the climate change results presented here is set in Chapter 8 (evaluation of simulation skill of the control runs and inherent natural variability of the global coupled climate models), and in Chapter 9 (evaluation of the simulations of 20th-century climate using the global coupled climate models). Table 8.1 describes the characteristics of the models, and Table 10.4 summarises the climate change experiments that have been performed with the AOGCMs and other models that are assessed in this chapter.
The TAR showed multi-model results for future changes in climate from simple 1% yr–1 CO2 increase experiments, and from several scenarios including the older IS92a, and, new to the TAR, two SRES scenarios (A2 and B2). For the latter, results from nine models were shown for globally averaged temperature change and regional changes. As noted in Section 10.1, since the TAR, an unprecedented internationally coordinated climate change experiment has been performed by 23 models from around the world, listed in Table 10.4 along with the results submitted. This larger number of models running the same experiments allows better quantification of the multi-model signal as well as uncertainty regarding spread across the models (in this section), and also points the way to probabilistic estimates of future climate change (Section 10.5). The emission scenarios considered here include one of the SRES scenarios from the TAR, scenario A2, along with two additional scenarios, A1B and B1 (see Section 10.2 for details regarding the scenarios). This is a subset of the SRES marker scenarios used in the TAR, and they represent ‘low’ (B1), ‘medium’ (A1B) and ‘high’ (A2) scenarios with respect to the prescribed concentrations and the resulting radiative forcing, relative to the SRES range. This choice was made solely due to the limited computational resources for multi-model simulations using comprehensive AOGCMs and does not imply any preference or qualification of these three scenarios over the others. Qualitative conclusions derived from those three scenarios are in most cases also valid for other SRES scenarios.
Additionally, three climate change commitment experiments were performed, one where concentrations of greenhouse gases were held fixed at year 2000 values (constant composition commitment) and the models were run to 2100 (termed 20th-century stabilisation here), and two where concentrations were held fixed at year 2100 values for A1B and B1, and the models were run for an additional 100 to 200 years (see Section 10.7). The span of the experiments is shown in Figure 10.4.
Table 10.4. Summary of climate change model experiments produced with AOGCMs. Numbers in each scenario column indicate how many ensemble members were produced for each model. Coloured fields indicate that some but not necessarily all variables of the specific data type (separated by climate system component and time interval) were available for download at the PCMDI to be used in this report; ISCCP is the International Satellite Cloud Climatology Project. Additional data has been submitted for some models and may subsequently become available. Where different colour shadings are given in the legend, the colour indicates whether data from a single or from multiple ensemble members is available. Details on the scenarios, variables and models can be found at the PCMDI webpage (http://www-pcmdi.llnl.gov/ipcc/about_ipcc.php). Model IDs are the same as in Table 8.1, which provides details of the models.
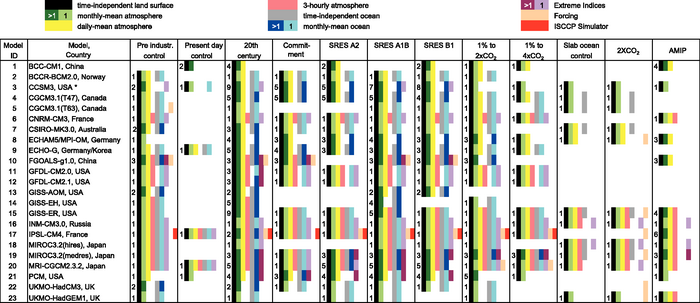
* Some of the ensemble members using the CCSM3 were run on the Earth Simulator in Japan in collaboration with the Central Research Institute of Electric Power Industry (CRIEPI).
This section considers the basic changes in climate over the next hundred years simulated by current climate models under non-mitigation anthropogenic forcing scenarios. While we assess all studies in this field, the focus is on results derived by the authors from the new data set for the three SRES scenarios. Following the TAR, means across the multi-model ensemble are used to illustrate representative changes. Means are able to simulate the contemporary climate more accurately than individual models, due to biases tending to compensate each other (Phillips and Gleckler, 2006). It is anticipated that this holds for changes in climate also (Chapter 9). The mean temperature trends from the 20th-century simulations are included in Figure 10.4. While the range of model results is indicated here, the consideration of uncertainty resulting from this range is addressed more completely in Section 10.5. The use of means has the additional advantage of reducing the ‘noise’ associated with internal or unforced variability in the simulations. Models are equally weighted here, but other options are noted in Section 10.5. Lists of the models used in the results are provided in the Supplementary Material for this Chapter.
Standard metrics for response of global coupled models are the equilibrium climate sensitivity, defined as the equilibrium globally averaged surface air temperature change for a doubling of CO2 for the atmosphere coupled to a non-dynamic slab ocean, and the TCR, defined as the globally averaged surface air temperature change at the time of CO2 doubling in the 1% yr–1 transient CO2 increase experiment. The TAR showed results for these 1% simulations, and Section 10.5.2 discusses equilibrium climate sensitivity, TCR and other aspects of response. Chapter 8 includes processes and feedbacks involved with these metrics.