|
|
 |
 |
 |
 |
|
IPCC Fourth Assessment Report: Climate Change 2007 |
|
 |
|
 |
|
|
Climate Change 2007: Working Group II: Impacts, Adaptation and Vulnerability 20.7.2 Sectoral and regional implications The range of increase in global mean temperature that could be expected over the next several centuries is highly uncertain. The compounding diversity in the regional patterns of temperature change for selected changes in global mean temperature is depicted elsewhere in IPCC (2007b, Figure SPM.6); so, too, are illustrations of geographic diversity in changes in precipitation and model disagreement about even the sign of this change (IPCC, 2007b, Figure SPM.7). Earlier sections of this chapter have also underscored the difficulty in anticipating the development of adaptive capacity and the ability of communities to take advantage of the incumbent opportunities. Despite all of this complexity, however, it is possible to offer some conclusions about vulnerability across regions and sectors as reported throughout this report. Locating the anticipated impacts of climate change on a map is perhaps the simplest way to see this point. Figure 9.5, for example, shows the spatial distribution of the projected impacts that are reported for Africa in Chapter 9. The power of maps like this lies in their ability to show how the various manifestations of climate change can be geographically concentrated. It is clear, as a result, that climate change can, by virtue of its multiple dimensions, be its own source of multiple stresses. It follows immediately that vulnerability to climate change can easily be amplified (in the sense that total vulnerability to climate change is greater than the sum of vulnerabilities to specific impacts) in regions like the south-eastern coast of Africa and Madagascar. Maps of this sort do not, however, capture sensitivities to larger indices of climate change (such as increases in global mean temperature); nor do they not offer any insight into the timing of increased vulnerabilities. Tables 20.8 and 20.9 address these deficiencies by summarising estimated impacts at global and regional scales against a range of changes in global average temperature. Each entry is drawn from earlier chapters in this report, and assessed levels of confidence are indicated. The entries have been selected by authors of the chapters and the selection is intended to illustrate impacts that are important for human welfare. The criteria for judging this importance include the magnitude, rate, timing and persistence/irreversibility of impacts, and the capacity to adapt to them. Where possible, the entries give an indication of impact trend and its quantitative level. In a few cases, quantitative measures of impact have now been estimated for different amounts of climate change, thus pointing toward different levels of the same impact that might be avoided by not exceeding given amounts of global temperature change. 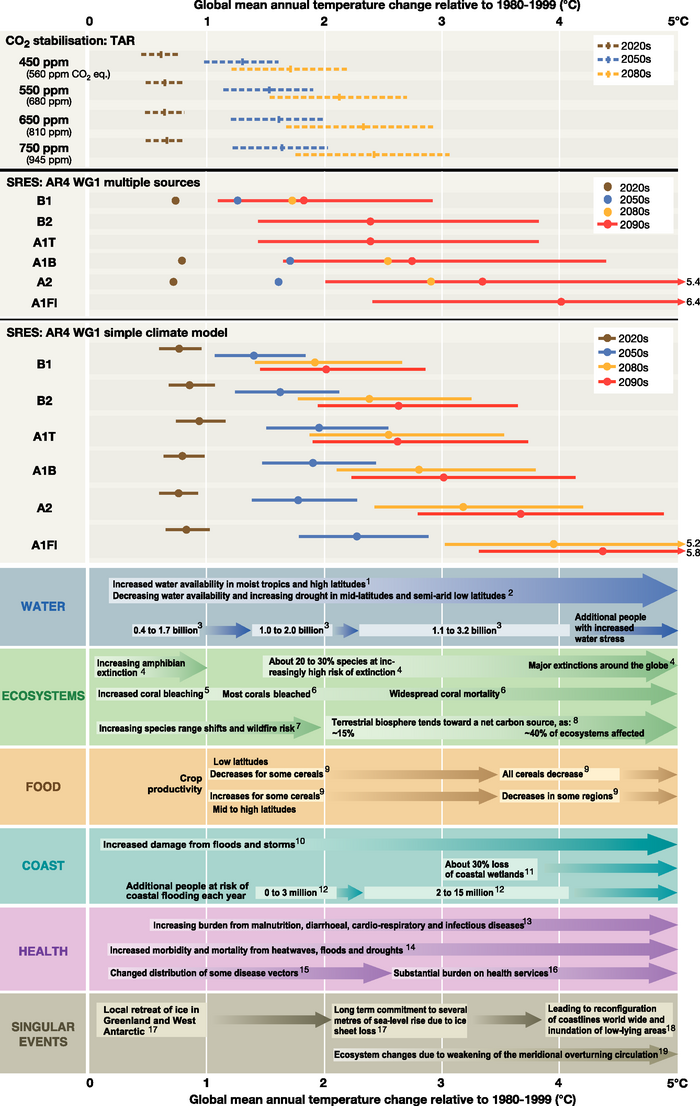 Table 20.8. Examples of global impacts projected for changes in climate (and sea level and atmospheric CO2 where relevant) associated with different amounts of increase in global average surface temperature in the 21st century. This is a selection of some estimates currently available. All entries are from published studies in the chapters of the Assessment. (Continues below Table 20.9) 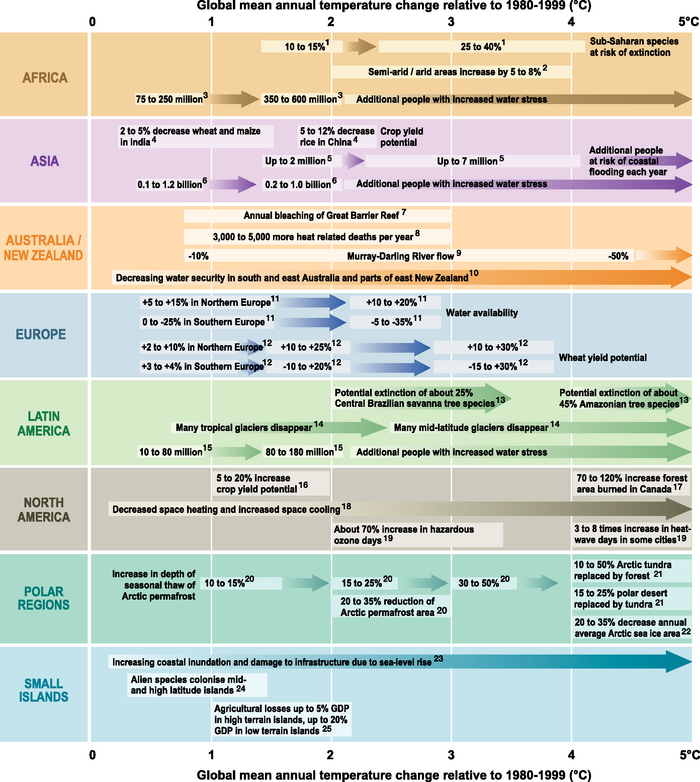 Table 20.9. Examples of regional impacts. See caption for Table 20.8. Table 20.8. (cont.) Edges of boxes and placing of text indicate the range of temperature change to which the impacts relate. Arrows between boxes indicate increasing levels of impacts between estimations. Other arrows indicate trends in impacts. All entries for water stress and flooding represent the additional impacts of climate change relative to the conditions projected across the range of SRES scenarios A1FI, A2, B1 and B2. Adaptation to climate change is not included in these estimations. For extinctions, ‘major’ means ~40 to ~70% of assessed species. The table also shows global temperature changes for selected time periods, relative to 1980-1999, projected for SRES and stabilisation scenarios. To express the temperature change relative to 1850-1899, add 0.5°C. More detail is provided in Chapter 2 [Box 2.8]. Estimates are for the 2020s, 2050s and 2080s, (the time periods used by the IPCC Data Distribution Centre and therefore in many impact studies) and for the 2090s. SRES-based projections are shown using two different approaches. Middle panel: projections from the WGI AR4 SPM based on multiple sources. Best estimates are based on AOGCMs (coloured dots). Uncertainty ranges, available only for the 2090s, are based on models, observational constraints and expert judgement. Lower panel: best estimates and uncertainty ranges based on a simple climate model (SCM), also from WGI AR4 (Chapter 10). Upper panel: best estimates and uncertainty ranges for four CO2-stabilisation scenarios using an SCM. Results are from the TAR because comparable projections for the 21st century are not available in the AR4. However, estimates of equilibrium warming are reported in the WGI AR4 for CO2-equivalent stabilisationa. Note that equilibrium temperatures would not be reached until decades or centuries after greenhouse gas stabilisation. Table 20.8. Sources: 1, 3.4.1; 2, 3.4.1, 3.4.3; 3, 3.5.1; 4, 4.4.11; 5, 4.4.9, 4.4.11, 6.2.5, 6.4.1; 6, 4.4.9, 4.4.11, 6.4.1; 7, 4.2.2, 4.4.1, 4.4.4 to 4.4.6, 4.4.10; 8, 4.4.1, 4.4.11; 9, 5.4.2; 10, 6.3.2, 6.4.1, 6.4.2; 11, 6.4.1; 12, 6.4.2; 13, 8.4, 8.7; 14, 8.2, 8.4, 8.7; 15, 8.2, 8.4, 8.7; 16, 8.6.1; 17, 19.3.1; 18, 19.3.1, 19.3.5; 19, 19.3.5 The time dimension is captured by the bars drawn at the top of Table 20.8; they indicate the range of global average temperature increase that could be expected during the 2020s, the 2050s and the 2080s among the SRES collection of unmitigated scenarios as well as a range of alternative stabilisation pathways (Nakićenović and Swart, 2000). The real message to be drawn from their inclusion is that no temperature threshold associated with any subjective judgment of what might constitute ‘dangerous’ climate change can be guaranteed by anything but the most stringent of mitigation interventions, at least not on the basis of current knowledge. Moreover, there is an estimated commitment to warming of 0.6°C due to past emissions, from which impacts must be expected, regardless of any future efforts to reduce emissions in the future. |
|
|
|