TS.2 Current knowledge about observed impacts on natural and managed systems
Observational evidence from all continents and most oceans shows that many natural systems are being affected by regional climate changes, particularly temperature increases (very high confidence). A global assessment of data since 1970 has shown it is likely that anthropogenic warming has had a discernible influence on many physical and biological systems.
The IPCC Working Group II Third Assessment found evidence that recent regional climate changes, particularly temperature increases, have already affected physical and biological systems [1.1.1]. The Fourth Assessment has analysed studies since the Third Assessment showing changes in physical, biological and human systems, mainly from 1970 to 2005, in relation to climate drivers, and has found stronger quantitative evidence [1.3, 1.4]. The major focus is on global and regional surface temperature increases [1.2].
Evaluation of evidence on observed changes related to climate change is made difficult because the observed responses of systems and sectors are influenced by many other factors. Non-climatic drivers can influence systems and sectors directly and/or indirectly through their effects on climate variables such as reflected solar radiation and evaporation [1.2.1]. Socio-economic processes, including land-use change (e.g., agriculture to urban area), land-cover modification (e.g., ecosystem degradation), technological change, pollution, and invasive species constitute some of the important non-climate drivers [1.2.1].
Much more evidence has accumulated over the past 5 years to indicate that the effects described above are linked to the anthropogenic component of warming. There are three sets of evidence which, taken together, support this conclusion (see Box TS.4).
1. There have been several studies that have linked responses in some physical and biological systems to the anthropogenic component of warming by comparing observed trends with modelled trends in which the natural and anthropogenic forcings are explicitly separated [1.4].
2. Observed changes in many physical and biological systems are consistent with a warming world. The majority (>89% of the >29,000 data sets whose locations are displayed in Figure TS.1) of changes in these systems have been in the direction expected as a response to warming [1.4].
3. A global synthesis of studies in this Assessment strongly demonstrates that the spatial agreement between regions of significant regional warming across the globe and the locations of significant observed changes in many systems consistent with warming is very unlikely to be due solely to natural variability of temperatures or natural variability of the systems [1.4].
Box TS.4. Linking the causes of climate change to observed effects on physical and biological systems
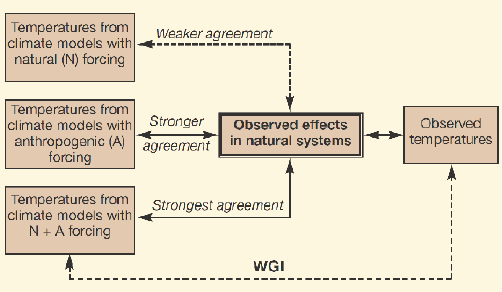
The figure above demonstrates the linkages between observed temperatures, observed effects on natural systems, and temperatures from climate model simulations with natural, anthropogenic, and combined natural and anthropogenic forcings. Two ways in which these linkages are utilized in detection and attribution studies of observed effects are described below.
1. Using climate models
The study of causal connection by separation of natural and anthropogenic forcing factors (Set of Evidence 1 on the preceding page) compares observed temporal changes in animals and plants with changes over the same time periods in observed temperatures as well as modelled temperatures using (i) only natural climate forcing; (ii) only anthropogenic climate forcing; and (iii) both forcings combined.
2. Using spatial analysis
For physical systems, (i) climate change is affecting natural and human systems in regions of snow, ice and frozen ground, and (ii) there is now evidence of effects on hydrology and water resources, coastal zones and oceans.
The main evidence from regions of snow, ice and frozen ground is found in ground instability in permafrost regions, and rock avalanches; decrease in travel days of vehicles over frozen roads in the Arctic; increase and enlargement of glacial lakes, and destabilisation of moraines damming these lakes, with increased risk of outburst floods; changes in Arctic and Antarctic Peninsula ecosystems, including sea-ice biomes and predators high on the food chain; and limitations on mountain sports in lower-elevation alpine areas (high confidence) [1.3.1]. These changes parallel the abundant evidence that Arctic sea ice, freshwater ice, ice shelves, the Greenland ice sheet, alpine and Antarctic Peninsula glaciers and ice caps, snow cover and permafrost are undergoing enhanced melting in response to global warming (very high confidence) [WGI AR4 Chapter 4].
Recent evidence in hydrology and water resources shows that spring peak discharge is occurring earlier in rivers affected by snow melt, and there is evidence for enhanced glacial melt in the tropical Andes and in the Alps. Lakes and rivers around the world are warming, with effects on thermal structure and water quality (high confidence) [1.3.2].
Sea-level rise and human development are together contributing to losses of coastal wetlands and mangroves and increasing damage from coastal flooding in many areas (medium confidence) [1.3.3.2].
There is more evidence, from a wider range of species and communities in terrestrial ecosystems than reported in the Third Assessment, that recent warming is already strongly affecting natural biological systems. There is substantial new evidence relating changes in marine and freshwater systems to warming. The evidence suggests that both terrestrial and marine biological systems are now being strongly influenced by observed recent warming.
The overwhelming majority of studies of regional climate effects on terrestrial species reveal consistent responses to warming trends, including poleward and elevational range shifts of flora and fauna. Responses of terrestrial species to warming across the Northern Hemisphere are well documented by changes in the timing of growth stages (i.e., phenological changes), especially the earlier onset of spring events, migration, and lengthening of the growing season. Based on satellite observations since the early 1980s, there have been trends in many regions towards earlier ‘greening’ of vegetation in the spring and increased net primary production linked to longer growing seasons. Changes in abundance of certain species, including limited evidence of a few local disappearances, and changes in community composition over the last few decades have been attributed to climate change (very high confidence) [1.3.5].
Many observed changes in phenology and distribution of marine and freshwater species have been associated with rising water temperatures, as well as other climate-driven changes in ice cover, salinity, oxygen levels and circulation. There have been poleward shifts in ranges and changes in algal, plankton and fish abundance in high-latitude oceans. For example, plankton has moved polewards by 10° latitude (about 1,000 km) over a period of four decades in the North Atlantic. There have also been documented increases in algal and zooplankton abundance in high-latitude and high-altitude lakes, and earlier fish migration and range changes in rivers [1.3]. While there is increasing evidence for climate change impacts on coral reefs, differentiating the impacts of climate-related stresses from other stresses (e.g., over-fishing and pollution) is difficult. The uptake of anthropogenic carbon since 1750 has led to the ocean becoming more acidic, with an average decrease in pH of 0.1 units [WGI AR4 SPM]. However, the effects of observed ocean acidification on the marine biosphere are as yet undocumented [1.3]. Warming of lakes and rivers is affecting abundance and productivity, community composition, phenology and the distribution and migration of freshwater species (high confidence) [1.3.4].
Effects of regional increases in temperature on some managed and human systems are emerging, although these are more difficult to discern than those in natural systems, due to adaptation and non-climatic drivers.
Effects have been detected in agricultural and forestry systems [1.3.6]. Changes in several aspects of the human health system have been related to recent warming [1.3.7]. Adaptation to recent warming is beginning to be systematically documented (medium confidence) [1.3.9].
In comparison with other factors, recent warming has been of limited consequence in the agriculture and forestry sectors. A significant advance in phenology, however, has been observed for agriculture and forestry in large parts of the Northern Hemisphere, with limited responses in crop management such as earlier spring planting in northern higher latitudes. The lengthening of the growing season has contributed to an observed increase in forest productivity in many regions, while warmer and drier conditions are partly responsible for reduced forest productivity and increased forest fires in North America and the Mediterranean Basin. Both agriculture and forestry have shown vulnerability to recent trends in heatwaves, droughts and floods (medium confidence) [1.3.6].
While there have been few studies of observed health effects related to recent warming, an increase in high temperature extremes has been associated with excess mortality in Europe, which has prompted adaptation measures. There is emerging evidence of changes in the distribution of some human disease vectors in parts of Europe and Africa. Earlier onset and increases in the seasonal production of allergenic pollen have occurred in mid- and high latitudes in the Northern Hemisphere (medium confidence) [1.3.7].
Changes in socio-economic activities and modes of human response to climate change, including warming, are just beginning to be systematically documented. In regions of snow, ice and frozen ground, responses by indigenous groups relate to changes in the migration patterns, health, and range of animals and plants on which they depend for their livelihood and cultural identity [1.3.9]. Responses vary by community and are dictated by particular histories, perceptions of change and range, and the viability of options available to groups (medium confidence) [1.3.9].
While there is now significant evidence of observed changes in physical and biological systems in every continent, including Antarctica, as well as from most oceans, the majority of studies come from mid- and high latitudes in the Northern Hemisphere. Documentation of observed changes in tropical regions and the Southern Hemisphere is sparse [1.5].