|
3.4. Contrail Occurrence and Persistence and Impact of Aircraft Exhaust
on Cirrus
Aircraft cause visible changes in the atmosphere by forming contrails that
represent artificially induced cirrus clouds. The conditions under which contrails
form are discussed in Section 3.2.4. This section
describes the formation, occurrence, and properties of persistent contrails
and how they compare with natural cirrus.
3.4.1. Cirrus and Contrails
Cirrus clouds (Liou, 1986; Pruppacher and Klett, 1997) contain mainly ice crystals
(Weickmann, 1945). The distinctive properties of cirrus and contrails derive
from the physics of ice formation. Ice particle nucleation occurs either through
homogeneous nucleation (when pure water droplets or liquid aerosol particles
freeze) or through heterogeneous nucleation, when freezing of the liquid is
triggered by a solid particle or surface that is in contact with the liquid
or suspended within the liquid. Both processes depend strongly on temperature
and relative humidity (Heymsfield and Miloshevich, 1995; see Section
3.2.4.2).
Comparisons of model simulations with observations suggest that we may understand
homogeneous nucleation (Ström et al., 1997; Jensen et al., 1998b) and are making
headway in understanding the potential contribution of heterogeneous nucleation
(DeMott et al., 1998; Rogers et al., 1998). Each of these freezing mechanisms
requires that the atmosphere be highly supersaturated with respect to the vapor
pressure of ice before crystals can form. For instance, supersaturations in
excess of 40-50% with respect to ice are needed for sulfuric acid particles
to freeze homogeneously (Tabazadeh et al., 1997) at temperatures above 200 K.
Observations of relative humidity with respect to ice at the leading edges of
wave clouds are consistent with the requirement of large ice supersaturations
for nucleation of ice on the bulk of the atmospheric aerosol (Heymsfield et
al., 1998a; Jensen et al., 1998c). Hence, there is a large supersaturation range
in which heterogeneous nuclei could lead to cirrus formation before the bulk
of the atmospheric particles freeze (DeMott et al., 1997). This potential for
heterogeneous nuclei to cause ice formation at ice supersaturations that are
relatively low compared to those needed to freeze sulfate particles leads to
concern about the role of aircraft exhaust in modifying ambient clouds (Jensen
and Toon, 1997).
|
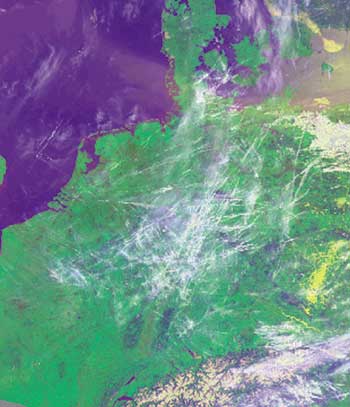
Figure 3-12: Contrails over central Europe on 0943 UTC 4 May
1995, based on NOAA-12 AVHRR satellite data (from Mannstein, 1997).
|
Ice crystal number densities are limited by competition between increasing
saturation as a result of cooling in vertical updrafts and decreasing saturation
as a result of growth of ice crystals. The depletion of vapor as a result of
growth of the first few ice crystals nucleated prevents further ice nucleation
on the remaining particles (Jensen and Toon, 1994). Once ice crystals form and
take up available water vapor, supersaturation declines and further nucleation
of ice ceases. This selectivity causes ice crystals in cirrus to be larger relative
to droplets in liquid water-containing clouds-apart from differences in saturation
vapor pressures over ice compared to water, which causes more water vapor to
be available for deposition on ice particles than on water droplets. Large ice
particles may precipitate rapidly. Many cirrus clouds have a "fuzzy" appearance
because rapid precipitation causes optically thin edges of clouds to be diffuse,
and precipitation allows particles to spread in the wind, forming long tails
of cloud. Ice crystal nucleation also depends on available aerosol in the upper
troposphere, the properties of which are only poorly known (Ström and Heintzenberg,
1994; Podzimek et al., 1995; Sassen et al., 1995; Schröder and Ström, 1997).
In some locations, upper tropospheric particles are dominated by sulfates (Yamato
and Ono, 1989; Sheridan et al., 1994). However, more recent data show that minerals,
organic compounds, metals, and other substances may often be present in significant
quantities (Chen et al., 1998; Talbot et al., 1998).
Cirrus clouds occur mainly in the upper troposphere. The mean tropopause altitude
is about 16 km in the tropics and 10 km (250 hPa) north of 45°N latitude (Hoinka,
1998). The tropopause temperature at northern mid-latitudes varies typically
between -40 and -65°C; it may reach below -80°C in the tropics. At mid-latitudes,
the upper troposphere often is humid enough for cirrus and persistent contrails
to form. The stratosphere is commonly so dry that cirrus (PSCs) and persistent
contrails form only in polar winter (for T > -60°C and p < 250 hPa, a 10-ppmv
H2O mixing ratio corresponds to less than 15% relative humidity). Ground-based
observers report a mean cirrus cover of 13% over oceans and 23% over land (Warren
et al., 1986, 1988). Satellite data (Wang et al., 1996; Wylie and Menzel, 1999)
identify larger cloud cover (~40%) by subvisible (optical depth t at 0.55 mm
below ~0.03) and semi-transparent (0.1 < t < 0.6) cirrus clouds. Cirrus clouds
are typically 1.5 (0.1 to 4) km thick; are centered at 9 (4 to 18) km altitude;
have a crystal concentration of 30 (10-4 to 104) L-1, with crystal lengths of
250 (1 to 8000) µm (see Dowling and Radke, 1990); and have an optical depth
at 0.55 µm of about 0.3 (0.01 to 30) (Wylie and Menzel, 1999). These typical
values of cirrus crystal concentration and mean particle size may be biased
by early studies that failed to make adequate measurements of ice crystals smaller
than about 50 µm. More recent studies suggest that crystal concentrations in
cirrus are often on the order of 1 cm-3 (Ström et al., 1997; Schröder et al.,
1998b), although crystal concentrations in wave clouds can exceed 10 cm-3. PSCs
(between the tropopause and ~25-km altitude) and noctilucent clouds (~80-km
altitude) contain ice and might therefore be included as very high altitude
forms of cirrus clouds. Systems of cirrus clouds have a lifetime that may reach
several hours or even days (Ludlam, 1980), but the lifetimes of particles within
clouds is much shorter.
|
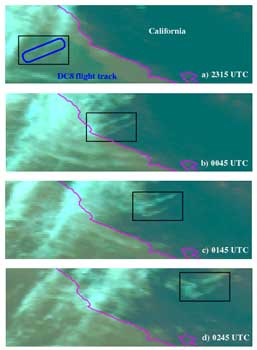
Figure 3-13: Time series of GOES-8 satellite images showing the
evolution of a contrail from an initial oval shape to extensive cirrus clouds
(from Minnis et al., 1998a).
|
Persistent contrail formation requires air that is ice-supersaturated (Brewer,
1946). Ice-supersaturated air is often free of visible clouds (Sassen, 1997)
because the supersaturation is too small for ice particle nucleation to occur
(Heymsfield et al., 1998b). Supersaturated regions are expected to be quite
common in the upper troposphere (Ludlam, 1980). The presence of persistent contrails
demonstrates that the upper troposphere contains air that is ice-supersaturated
but will not form clouds unless initiated by aircraft exhaust (Jensen et al.,
1998a). Aircraft initiate contrail formation by increasing the humidity within
their exhaust trails, whereas local atmospheric conditions govern the subsequent
evolution of contrail cirrus clouds. Indeed, the ice mass in long-lasting contrails
originates almost completely from ambient water vapor (Knollenberg, 1972).
Ice-supersaturated air masses are often formed when ice-saturated air masses
are lifted by ambient air motions. While the air lifted, it may remain cloud-free
until it is cooled adiabatically to near-liquid saturation (Ludlam, 1980). Other
evidence for large supersaturation occurring in the upper troposphere is provided
by cirrus fallstreaks that grow while falling through supersaturated air layers
(Ludlam, 1980) and by a few localized humidity measurements (Brewer, 1946; Murphy
et al., 1990; Ovarlez et al., 1997; Heymsfield et al., 1998b). Recent humidity
measurements by commercial aircraft show that-in flights between Europe, North
and South America, Africa, and Asia-14% of flight time was in air masses that
were ice-supersaturated with a mean value of 15% (Helten et al., 1998; Gierens
et al., 1999).
3.4.2 Cirrus and Contrail Models
Small-scale, regional, and global models have been used to study cirrus clouds
and contrails. Small-scale models simulate the details of cloud formation in
a single parcel of air along some defined trajectory (e.g., Jensen et al., 1994b).
High-resolution 2-D models have simulated the dynamics and microphysics of cirrus
(Starr and Cox, 1985) and contrails (Gierens, 1996; Chlond, 1998). Regional
and global models describe the large-scale dynamics of clouds with simpler representations
of microphysical cloud processes (Sundqvist, 1993; Lohmann and Roeckner, 1995;
Fowler et al., 1996; Westphal et al., 1996). Regional-scale (typically 10-km
horizontal grid-scale) and global-scale models are not able to resolve the vertical
motions and small-scale temperature and humidity fluctuations (Gierens et al.,
1997) that drive supersaturations involved in cirrus nucleation. However, global
models with prescribed or parameterized contrail cover have been useful for
understanding the radiative impact of a change in cloud cover as a result of
aircraft emissions (Ponater et al., 1996).
|
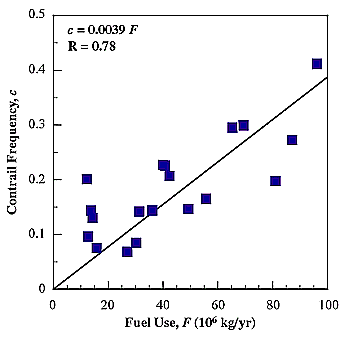
Figure 3-14: Correlation of mean annual contrail frequency and
estimated May 1990 aircraft fuel usage above 7-km altitude.
|
3.4.3. Contrail Occurrence
At plume ages between 1 min and 1 h, contrails grow much faster horizontally
(to several km width) than vertically (200 to 400 m), especially in highly sheared
environments (Freudenthaler et al., 1995, 1996; Sassen, 1997). Young contrails
spread as a result of turbulence created by aircraft vortices (Lewellen and
Lewellen, 1996; Gerz et al., 1998; Jensen et al., 1998a,b,c), shear in the ambient
wind field (Freudenthaler et al., 1995; Schumann et al., 1995; Dürbeck and Gerz,
1996; Gierens, 1996), and possibly radiatively driven mixing (Jensen et al.,
1998d).
Contrails often become wide and thick enough to induce radiative disturbances
that are sufficient to be detectable in multispectral satellite observations.
They have been observed at 1-km spatial resolution with instruments such as
the Advanced Very High Resolution Radiometer (AVHRR) on board National Oceanic
and Atmospheric Administration (NOAA) polar-orbiting satellites (e.g., Lee,
1989) and at 4-km resolution in the infrared with the Geostationary Operational
Environmental Satellite (GOES) (Minnis et al., 1998a). The AVHRR channels in
the 11- to 12-µm range (4 and 5) are particularly suited to detect thin ice
clouds because of the different emissivity of ice particles in this spectral
range (King et al., 1992; Minnis et al., 1998c). Figure
3-12 shows, for example, a mid-European scene derived from AVHRR data in
these channels, combined with the visible channel to represent the surface,
for a day when many line-shaped contrails were formed by heavy air traffic (Mannstein,
1997). The figure shows that aircraft trigger contrail cirrus that evolves into
cirrus clouds that are much more extensive in scale than the initial contrails.
Such spread and deformed contrail cirrus can no longer be distinguished from
naturally occurring cirrus. In Figure 3-12, contrails
that still have a line-shaped appearance cover about 5% of the scene.
|
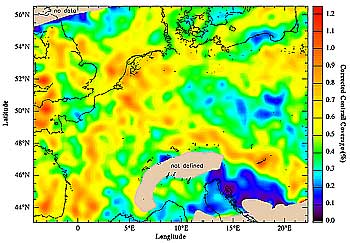
Figure 3-15: Annual mean corrected contrail coverage at noon
over mid-Europe in 1996, as derived from AVHRR data from the NOAA-14 satellite
(from Mannstein et al., 1999).
|
Aged contrails often cannot be distinguished from cirrus, which poses an observational
problem in determining the frequency and area of coverage by contrails. An important
example of the persistence of contrails and their evolution into more extensive
cirrus is shown in Figure 3-13. An initial oval contrail
observed in GOES-8 satellite images diffused as it was advected over California
until it no longer resembled its initial shape 3 h later (Minnis et al., 1998a).
The exhaust from this single aircraft flying for less than 1 h in a moist atmosphere
caused a cirrus cloud that eventually covered up to 4,000 km2 and lasted for
more than 6 h. Other contrails and contrail clusters were observed to develop
over periods of 7 to 17 h, spreading to cover areas of 12,000 to 35,000 km2.
Such dispersed contrails are usually indistinguishable from natural cirrus;
hence, satellite detection algorithms based on the linear structures of young
contrails will not detect these dispersed contrails.
At present, observations of actual frequency or areal coverage of Earth by
contrails are limited to a few selected regions. Contrail frequency refers to
the probability that a contrail will be observed somewhere within the scene
being viewed; area of coverage refers to the fraction of the area of the scene
in which contrails are observed. Estimates of contrail coverage or occurrence
have been made directly or indirectly from surface (Detwiler and Pratt, 1984;
Minnis et al., 1997) and satellite observations (Joseph et al., 1975; Carleton
and Lamb, 1986; Lee, 1989; DeGrand et al., 1990; Schumann and Wendling, 1990;
Betancor-Gothe and Grassl, 1993; Bakan et al., 1994; Mannstein et al., 1999).
Data for the frequency of contrails are available from surface-based observations
at 19 locations across the continental United States of America for every hour
during 1993-94 (Minnis et al., 1997). The data indicate that contrail frequency
peaks around February/March and is at a minimum during July. Annual mean persistent
contrail frequency (not the cover) for the 19 sites was 12%. When related to
fuel use and extended to the remainder of the country, mean annual contrail
frequency for the United States of America is estimated at 9% (Minnis et al.,
1997). The relationship between fuel consumption and contrail frequency from
this data set is shown in Figure 3-14. The correlation
implies that contrail coverage is limited mainly by the number of aircraft flights,
not by atmospheric conditions at cruise altitudes. Pilots flying over the former
Soviet Union have reported that contrails occur most frequently in winter and
spring and less often during summer (Mazin, 1996). Sky photographs taken from
1986 to 1996 over Salt Lake City, Utah, reveal a seasonal cycle in contrail
frequency, with a maximum in fall and winter and a minimum in July (Sassen,
1997). These data are similar to observations from a site 64 km north (Minnis
et al., 1997) of Salt Lake City. Sassen (1997) and Minnis et al. (1997) found
that contrails occur with cirrus in approximately 80% of observations. The coincidence
of cirrus and contrails suggests that cloud-free supersaturated regions are
usually interspersed with areas in which natural clouds have actually formed.
|
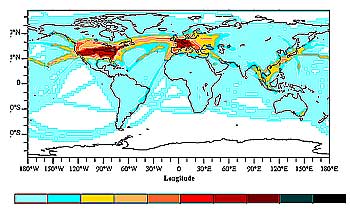
Figure 3-16: Persistent contrail coverage (in % area cover)
for the 1992 aviation fleet, assuming linear dependence on fuel consumption
and overall efficiency of propulsion h of 0.3. The global mean cover is 0.1%
(from Sausen et al., 1998).
|
|
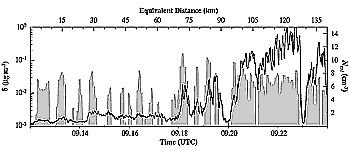
Figure 3-17: Time series of ice crystal concentration (Ncvi,
thick line) and concentration of light-absorbing material contained in ice
crystals (d, shaded area) for a flight through a cirrus layer in a region with
heavy air traffic (adapted from Ström and Ohlsson, 1998).
|
From an analysis of AVHRR infrared images taken over the northeast Atlantic
and Europe, a mean contrail cover of 0.5% was derived for 1979-81 and 1989-92
(Bakan et al., 1994). A distinct seasonal cycle was found, with a southward
displacement of the maximum cover during winter. Maximum coverage (~2%) occurred
during summer, centered along the North Atlantic air routes. Using AVHRR channel
4 and 5 differences and a pattern-recognition algorithm to differentiate line-shaped
clouds from fuzzy cirrus clouds, the contrail cover-defined as line-shaped clouds
over mid-Europe-was systematically evaluated for all of 1996 using nearly all
noon passages of the NOAA-14 satellite (see Figure 3-15)
(Mannstein et al., 1999). Contrails are not uniformly distributed; instead,
they lie along air traffic corridors and accumulate near upper air route crossings.
As with observations over the United States and the former Soviet Union, maximum
coverage occurred during winter and spring. At noon on average over the year,
line-shaped contrails cover about 0.5% of the area of the mid-European region
shown in this figure. This coverage represents the lower bound for the actual
contrail cover because the algorithm cannot identify non-line-shaped contrails.
Contrail coverage at night over Europe is one-third of the noon-time contrail
cover (Mannstein et al., 1999).
Contrails often occur in clusters within regions that are cold and humid enough
to allow persistent contrails to form. Contrail clusters observed in satellite
data indicate that these air masses cover 10 to 20% of the area over mid-Europe
(Mannstein et al., 1999) and parts of the United States of America (Carleton
and Lamb, 1986; Travis and Changnon, 1997), consistent with the fraction of
air masses expected to be ice-supersaturated at cruise altitudes. Hence, as
air traffic increases in these regions, persistent contrail coverage is also
expected to increase, possibly up to a limit of 10-20%.
Estimates of global coverage by air masses that are sufficiently cold and humid
for persistent contrails can be obtained using meteorological analysis data
of temperature and humidity, a model to estimate the frequency of ice-saturation
in each grid cell as a function of the analyzed relative humidity, and the Schmidt-Appleman
criterion (depending on h; see Section 3.2.4.1) for
contrail formation conditions. Using 11 years of meteorological data from the
European Center for Medium Range Weather Forecast (ECMWF), the cover of suitable
air masses is found to be largest in the upper troposphere, especially in the
tropics (global mean value of 16%) (Sausen et al., 1998). This coverage is similar
in size to the area covered by clusters of contrails in satellite data and the
frequency of ice-supersaturated air masses observed along commercial aircraft
routes (Gierens et al., 1999). The expected contrail cover is then computed
from the product of the air mass coverage and the fuel consumption rate in the
same region, with the latter chosen as one of several possible measures of air
traffic. The product is scaled to give a 0.5% mean contrail cover in the European/Atlantic
region (30°W to 30°E, 35 to 75°N) as considered by Bakan et al. (1994). The
resulting contrail cover (see Figure 3-16) for 1992
fuel emissions and h = 0.3 is 0.087% (about 0.1%) in the global mean, with a
local maximum of 5% over the eastern United States of America. The computed
contrail coverage over southeastern Asia is only slightly smaller than that
over Europe and North America. Although air traffic is much less extensive over
southeastern Asia, this high contrail coverage may result because this region
more often has ice-supersaturated air. However, the predicted contrail coverage
over North America and southeastern Asia has not yet been verified by observations.
Predicted regional differences are sensitive to the representation of the number
of aircraft in operation. For example, in some regions, a large fuel consumption
density is caused by a few large aircraft (Gierens et al., 1998). Studies have
not been performed to evaluate the accuracy of humidity values provided by meteorological
data. The results depend linearly on scaling by the cover observed in the reference
region, as provided here by Bakan et al. (1994). Other data imply global cover
values between 0.02 and 0.1% (Gierens et al., 1998). A value larger than 0.1%
(possibly 0.2%) cannot be excluded because the analysis uses only thermodynamic
contrail formation conditions and the scaling is based solely on observed line-shaped
contrail cover.
3.4.4. Contrail Properties
The relatively small particles present in newly formed contrails serve to distinguish
contrail radiative properties from those of most natural cirrus (Grassl, 1970;
Ackerman et al., 1998; see also Section 3.6). Measurements
of contrail particles with impactors and optical probes (see also Section
3.2.4 and Table 3-1) reveal a wide variety of
size, shape, and spectral size distributions. The results depend on plume age,
ambient humidity, ambient aerosol, and other parameters. At a plume age of 30
to 70 s, ice particles have been found to form a single-mode log-normal size
distribution with a volume-equivalent radius in the range of 0.02 to 10 µm,
a mean radius of about 2 µm, and maximum dimension of 22 µm. Particle shapes
are mainly hexagonal plates, along with columns and triangles. The axial ratios
of the columns were found to be less than 2, and the shapes of the crystals
were already established for particles of about 1-µm radius (Goodman et al.,
1998). Contrail particle sizes increase with time in humid air. Ice particles
observed in 2-min-old contrails typically have radii of 2 to 5 µm with shapes
that are almost spherical, indicating frozen solution droplets (Schröder et
al., 1998b). On the other hand, some contrail particles strongly polarize light,
indicating non-spherical shapes (Freudenthaler et al., 1996; Sassen, 1997).
After 10 min to 1 h, contrail particle size distributions may range from 32
to 100 µm or even 75 µm to 2 mm (Knollenberg, 1972; Strauss et al., 1997).
Particle properties within a contrail core differ from those at the edges of
the contrail. In the center of contrails, insufficient water vapor is available
to allow the large number of ice particles to grow to large crystals. At the
edges, ice supersaturation is greater, thereby sometimes allowing ice crystals
to form up to 300 µm in diameter (Heymsfield et al., 1998a). The larger particles
have various shapes, with the largest being bullet rosettes (Lawson et al.,
1998). Such large particles are within the natural variability of cirrus particle
sizes. As a consequence, old dispersed contrails appear to have particle sizes
similar to those in surrounding cirrus (Duda et al., 1998; Minnis et al., 1998a).
Aircraft create a large number of new ice crystals that grow from ambient water
vapor. As a contrail spreads, some evidence suggests that ice crystals are neither
lost nor created in significant numbers. In one remote-sensing study, the total
number of particles (about 2.6 x 10⁹ ice crystals per cm of contrail length)
in a contrail was found to remain constant as the contrail dispersed and the
particle concentration (particles per unit volume) dropped (Spinhirne et al.,
1998). In situ measurements (Schröder et al., 1998b) reveal 108 to 109 particles
larger than 4.5-mm diameter formed per cm of contrail length. In contrast, changes
in particle number will occur when some particles eventually sediment out of
the contrail and new particles are nucleated as a result of air motions induced
by the contrail. The ice water content of new contrails increases with time
to exceed the amount of water emitted by the aircraft by more than two orders
of magnitude. However, the water content per unit volume remained approximately
constant in the case observed by Spinhirne et al. (1998). The optical depth
of contrails remains nearly constant during the first hour despite horizontal
spreading (Jäger et al., 1998).
3.4.5. Impact of Aircraft Exhaust on Cirrus Clouds
and Related Properties
Aircraft may perturb natural cirrus through the addition of water vapor, soot,
and sulfate particles and by inducing vertical motions and turbulent mixing
(Gierens and Ström, 1998). Observations of cirrus coverage in certain regions
have found perturbations from anthropogenic aerosol (Ström et al., 1997). Persistent
contrails are often associated with or embedded in natural cirrus (Minnis et
al., 1997; Sassen, 1997). Such in-cloud contrails may be formed slightly above
the Schmidt-Appleman temperature threshold because ambient ice particles that
enter the engine inlet increase the humidity in the exhaust plume (Jensen et
al., 1998a; Kärcher et al., 1998a). Some evidence associates in-cloud contrails
with regions of enhanced absorbing material and enhanced ice crystal number
densities (Ström and Ohlsson, 1998). The presence of HNO3 may increase the hygroscopic
growth of supercooled cloud droplets (Laaksonen et al., 1997), and HNO3 dissolved
in sulfate solution droplets may change their freezing behavior. The importance
of such perturbations has not been quantified.
|
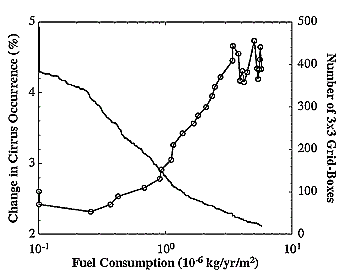
Figure 3-18: Change in cirrus occurrence frequency between
1987-1991 and 1982-1986 (in %) computed from surface observations over the
North Atlantic Ocean averaged over grid boxes with fuel consumption above 8
km greater than indicated on the x-axis (open circles).
|
|
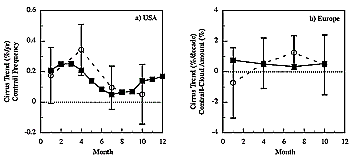
Figure 3-19: Observed monthly variation of contrail occurrence
frequency (solid squares) and seasonal trends of cirrus cover (open circles) for
(a) the United States of America (%/yr) and (b) Europe (%/decade).
|
Soot particles originating from aircraft exhaust may act as freezing nuclei.
In an atmosphere with few freezing nuclei, this perturbation could lead to an
expansion of cirrus cover, a change in average particle size, and related changes
in cloud surface area and optical depth (Jensen and Toon, 1997)-hence have consequences
for radiative forcing (see Section 3.6.5). For aircraft
to alter cirrus properties, exhaust particles would need to be more efficient
or more abundant than ice nuclei currently existing in the atmosphere. If the
predominant particle that freezes to form ice contains sulfate, aircraft soot
could serve as important ice nuclei because sulfate particles require a relatively
high supersaturation before freezing occurs. Over the central United States
of America, however, as many as 0.1 to 0.2 cm-3 freezing nuclei (effective at
-35°C) have been found in the upper troposphere (DeMott et al., 1998), indicating
that the number of freezing nuclei is not always small. Some observations show
that aircraft exhaust does not contain large numbers of ice nuclei active at
temperatures above -35°C (Rogers et al., 1998). Soot and metals were found to
be significant, but not dominant, components of ice nuclei in contrails (Chen
et al., 1998; Petzold et al., 1998; Twohy and Gandrud, 1998).
Aircraft measurements in and near clouds have indicated the presence of light-absorbing
material contained inside ice crystals. The distribution pattern and the amount
of measured absorbers suggest that the material is related to aircraft soot
(Ström and Ohlsson, 1998) (Figure 3-17). For the same
abundance of aerosol particles, clouds perturbed by absorbing material contained
1.6 to 2.8 times more ice crystals than unperturbed portions of clouds. These
observations suggest that aircraft-produced particles enhance cloud ice particle
concentrations, although they have not revealed the physical mechanism involved.
Specifically, exhaust soot particles may have been involved in ice crystal formation
within the cirrus or formed contrail ice particles within the exhaust plume
before being incorporated into the cloud. These observations are roughly consistent
with calculations of a cirrus cloud forming in a region of recent exhaust trails
(Jensen and Toon, 1997).
Cirrus clouds may also be perturbed by enhanced sulfate aerosol. Small sulfate
particles (e.g., 10-nm radius) are unlikely to be ice nuclei or cloud condensation
nuclei. Larger particles would be more efficient. Such large particles may originate
as ambient sulfate particles enlarged by growth from sulfur gases emitted by
aircraft or by processing of liquid exhaust particles in short-lived contrails
(see Section 3.2). Because ice nucleation processes tend
to be self-limiting (Jensen and Toon, 1994), cirrus cloud properties would change
only slightly if the number of sulfate particles increased while the size distribution
and composition of ambient sulfate particles remained constant. On the other
hand, large sulfate particles-such as those induced by the Mt. Pinatubo volcanic
cloud-could lead to a significant increase in the number of ice crystals, optical
depth, and radiative forcing of cirrus clouds (Jensen and Toon, 1992). Cloud
modifications would require a large increase in the number of larger sulfate
particles; such modifications would occur primarily in cirrus that were very
cold (T < -50°C) and weakly forced by slow updrafts. Lidar observations of a
cirrus cloud embedded in aerosol from the Mt. Pinatubo eruption show significantly
higher than normal ice crystal concentrations (Sassen, 1992; Sassen et al.,
1995). Satellite data analyzed after the Mt. Pinatubo eruption suggest that
the volcanic aerosol reduced the occurrence of cirrus clouds with high extinction
coefficients, increased the occurrence of clouds with low extinction coefficients,
and increased extinction in optically thick clouds (Minnis et al., 1993; Wang
et al., 1995). Hence, some available models and data suggest that aircraft exhaust
could play a significant role in modifying the properties of clouds. However,
the magnitude and nature of these modifications are not well understood.
Table 3-5: Computed trend values and differences of trend
values in cirrus/high cloud amounts (% of Earth surface cover per decade)
from surface and ISCCP satellite data sets taken between 1971 and 1991 for
regions categorized as having a mean value of contrail coverage less than
and greater than 0.5% as computed by Sausen et al. (1998) for 1992 aircraft
operations (Minnis et al., 1998b). Differences in trends between contrail
cover regions are shown as "trend difference" values.
The last two rows (Global ISCCP, Global Surface) indicate global (ocean
+ land) trends in respective data sets. The time periods of the data sets
are also indicated. Statistical significance refers to level of confidence
in difference between trends for the two regions. An asterisk indicates
insufficient resolution for analysis. Dashes indicate a confidence level
less than 95%.
|
| |
|
Trend (% per decade)
with Computed
|
in Regions
Contrail Cover
|
|
|
| |
Period |
< 0.5%
|
> 0.5%
|
Trend Difference
(% per decade) |
Significance of
Difference (%) |
| |
|
|
|
|
|
| Ocean from ISCCP |
1984-90 |
4.3
|
5.9
|
1.6
|
-
|
| Land from ISCCP |
1984-90 |
1.2
|
4.7
|
3.5
|
95
|
| |
|
|
|
|
|
| Ocean from surface |
1971-81 |
*
|
*
|
|
*
|
| Land from surface |
1971-81 |
-0.21
|
2.1
|
2.3
|
99
|
| |
|
|
|
|
|
| Ocean from surface |
1971-92 |
0.75
|
0.24
|
-0.51
|
-
|
| Land from surface |
1971-92 |
-1.5
|
0.10
|
1.6
|
99
|
| |
|
|
|
|
|
| Global ISCCP |
1984-90 |
3.2
|
5.2
|
1.9
|
99
|
| Global surface |
1984-90 |
0.0
|
1.0
|
1.0
|
-
|
|
|
Sedimentation of large particles in persistent contrails may remove water vapor
from the upper troposphere, possibly reducing radiative heating by water vapor,
and cause seeding of lower level clouds (Murcray, 1970; Knollenberg, 1972).
Sedimentation of ice crystals, which has been observed occasionally (Konrad
and Howard, 1974; Schumann, 1994; Heymsfield et al., 1998a), becomes important
only in strongly supersaturated air (Hauf and Alheit, 1997) when large ice crystals
form and have the potential to fall through lower-lying saturated air in which
they will not evaporate readily. Because no attempts have been made to quantify
the precipitation rate from contrails, the significance of this precipitation
has not been assessed.
|