|
4.2.3. Model Results for Subsonic Aircraft Emissions
4.2.3.1. Ozone Perturbation
|
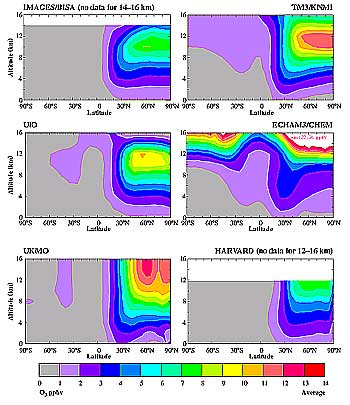
Figure 4-1: Annual (2015) and zonal average increases of ozone
volume mixing ratios [ppbv] from aircraft emissions calculated by six
3-D models. The IMAGES/BISA model does not give results above 14 km, and
the HARVARD model does not give results above 12 km.
|
|
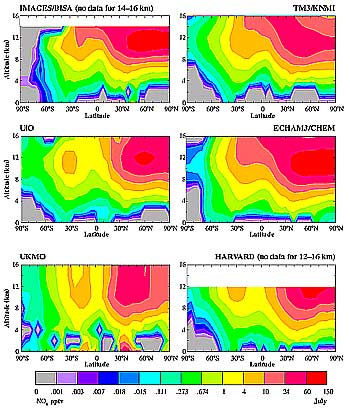
Figure 4-2: July zonal average increase in NOx [pptv]
from aircraft.
|
Figure 4-1 presents annual zonal average increases
of O3 volume mixing ratios caused by aircraft
NOx emissions predicted by the six models for
the year 2015. As this figure shows, the models treat the tropopause significantly
differently, which leads to qualitatively different O3
distributions and calculated O3 perturbations
near the tropopause. The UiO model calculates a maximum increase of O3
of about 9 ppbv around 40-80°N at an elevation of 10-13 km. Throughout most
of the Northern Hemisphere, increases larger than 1 ppbv are calculated. The
IMAGES/BISA and HARVARD models calculate somewhat smaller peak perturbations
of about 7 ppbv. In contrast, the Tm3/KNMI and the UKMO models calculate
maximum changes of about 11 ppbv. The UKMO model computes large increases up
to the 16-km level, probably as a result of relatively large vertical exchange
rates in the vicinity of the tropopause. In contrast to the other models, the
ECHAm3/CHEM model predicts the highest O3
perturbations in the Northern Hemisphere and Southern Hemisphere LS. Tropospheric
changes are smaller than in the other models, however. The difference may be
partly a result of the length of the ECHAm3/CHEM model run. This
model has a representation of the stratosphere and reported results from the
average of the last 10 years of a 15-year simulation-long enough to propagate
aircraft emissions and O3 perturbation in the
Northern Hemisphere to the Southern Hemisphere (via the stratosphere). The other
3-D models do not account for such stratospheric transport processes because
they constrain O3 concentrations in their upper
model levels: They fix their upper model layer concentrations using observations,
or they prescribe O3 fluxes from the stratosphere
into the troposphere. The use of these boundary conditions could lead to a calculated
impact on stratospheric O3 that is too small.
It may also be that the ECHAm3/CHEM model has too efficient transport
in the LS.
The effect of constraining concentrations and fluxes at the upper boundary
of the 3-D models was checked by running the stratospheric 2-D Atmospheric and
Environmental Research, Inc. (AER) model for the same subsonic scenario. Consistent
with the 3-D models, the AER model calculates a maximum O3
increase of 8-10 ppbv in the Northern Hemisphere at an altitude of 8-12 km.
In the stratosphere at 16 km, small increases of 2 ppbv in the Southern Hemisphere
and 6 ppbv in the Northern Hemisphere are calculated-somewhat higher, but consistent
with most 3-D models. Calculated O3 increases
are strongest in the UT and the LS. In the lower troposphere (< 6 km), the increase
is reduced by a factor of about 5 in mixing ratio compared to the UT. All models
calculate that about 85% of the O3 increase for
1992 is in the Northern Hemisphere; for 2015 and 2050, the portions are about
80 and 75%, respectively.
Although emissions of precursor NOx are spatially
distributed heterogeneously, the resulting O3
increases are distributed more uniformly as a result of the combined effects
of strong longitudinal mixing and the relatively long residence time of O3
in the free troposphere and LS. All models show efficient transport of excess
O3 from source regions at mid-latitudes to high
latitudes, where the residence time of O3 is
particularly long as a result of decreased deposition (Stevenson et al., 1997;
Wauben et al., 1997; Berntsen and Isaksen, 1999).
There may be a strong seasonal cycle in the calculated impact of aircraft emissions
on O3. For example, using the same emission scenarios,
the UiO and the UKMO models calculate a 40% larger increase of O3
in the Northern Hemisphere in April compared to July (Stevenson et al., 1997;
Berntsen and Isaksen, 1999). Other models find much weaker seasonal cycles (e.g.,
IMAGES/BISA and ECHAm3/CHEM), or find maximum increases in summer
(e.g., Tm3/KNMI and HARVARD). These seasonal differences are probably
associated with different background NOx conditions
in the different models (see Section 4.2.3.2).
4.2.3.2. NOx Perturbation
Figure 4-2 shows calculated zonal average increases
of NOx from aircraft emissions in July 2015.
In the Northern Hemisphere, all but one model calculate increases of up to 150
pptv. These increases can be compared with background levels of 50-200 pptv
at northern mid-latitudes in the 12-km region. In the stratosphere, the ECHAm3/CHEM
model calculates larger increases, probably as a result of more efficient transport
to the stratosphere. The height distribution of NOx
increases is very similar among models. All models also predict noticeable increases
in upper tropospheric NOx at low latitudes in
the Southern Hemisphere. Only small increases are estimated in the lower troposphere.
Background NOx conditions, however, are rather
different in the 3-D CTMs. For instance, at 12 km at 50°N, calculated background
NOx mixing ratios may vary, depending on the
season, by a factor of 2 to 4. Such large differences could be important for
O3 production because of the nonlinear dependency
of net O3 production on NOx
concentrations, although, for the model scenarios explored, the global O3
increase appears to be almost linear for most of the anticipated NOx
injections in the models (see Figure 4-3).
4.2.3.3. Future Total Ozone Increases from Aircraft
Emissions and Comparison with Increases from Other Sources
|
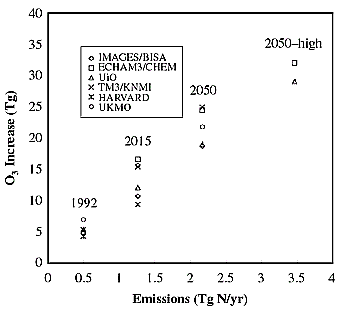
Figure 4-3: Increase in annual average global O3 abundance
(Tg O3) up to 16 km from present and future aircraft emissions.
|
Figure 4-3 presents the increase of global O3
abundance up to 16 km from aircraft emissions. The annual emissions of 0.5,
1.27, and 2.17 Tg N correspond to (projected) emissions for 1992, 2015, and
2050, respectively. Calculated O3 increases range
from 4 to 7 Tg in 1992, 9 to 17 Tg in 2015, and 19 to 24 Tg in 2050. For each
CTM, the global O3 increase scales almost linearly
with aircraft NOx emissions-even for the 2050
high-demand sensitivity study G (3.46 Tg N yr-1). However, O3
production is less efficient at high NOx emissions.
The nearly linear response of global O3 increase
to aircraft NOx emissions was not anticipated,
given the well-known nonlinear O3 production
as a function of NOx (discussed in Chapter
2). The main explanation seems to be that aircraft NOx
and associated reservoir species (e.g., HNO3)
are transported out of aircraft corridors, where net O3
production depends more linearly on NOx. We should
recognize, however, that all of the global models used in this study have a
coarse resolution that may systematically overestimate the O3
production. Secondary effects are background increases in CH4
and CO (as a result of enhanced surface emissions in 2015 and 2050), leading
to somewhat more efficient O3 production per
NOx molecule emitted, and the shift of emissions
from Northern Hemisphere mid-latitudes toward the tropics, where background
NOx concentrations are smaller.
To further test linearity in O3 increases to
NOx emission beyond the upper limit selected
in these model studies, an extremely high NOx
emission of 1.5 times the high-demand, low-technology case (Scenario G) was
run with the UiO model. This scenario showed only slight nonlinearity at lower
NOx emissions. This extreme simulation indicated
that a level of nonlinearity was reached at northern latitudes where O3
increases of only 10% were obtained, whereas at southern latitudes, where emissions
are smaller, O3 increases (approximately 50%)
were nearly linear with increases in NOx emissions.
Figure 4-4 shows the global increases of total O3
from aircraft emissions in 2015 and 2050 relative to those in 1992-that is,
the difference of O3 budgets for scenarios listed
in Table 4-4 (D with respect to B and F with respect
to B). The same figure also shows the increases of O3
in 2015 and 2050 from the effects of changes in surface emissions (Section
4.2.2.1)-that is, the differences for scenarios C with respect to A and
E with respect to A. Aircraft emissions account for approximately 15-30% of
the total O3 increase in 2015 and 15-20% in 2050.
It should be noted, however, that the projections of aircraft emissions and
the IPCC IS92a scenario underlying the increase of surface emissions are extremely
uncertain. Changes in aircraft or surface emissions scenarios could change the
relative contribution from aircraft emissions to O3
perturbations significantly. Using scenario G (high demand), an approximately
45% higher increase of O3 from aircraft is calculated
in 2050 by the UiO model (see sensitivity studies).
4.2.3.4. Influence of Changing OH on CH4
Lifetime
|
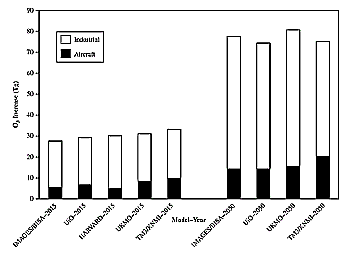
Figure 4-4: Increases in global total tropospheric ozone abundances
(Tg O3) in 2015 and 2050 from aircraft and other anthropogenic (industrial)
emissions relative to 1992.
|
As discussed in Section 2.1.4, aircraft NOx
emissions lead to higher OH concentrations. In the troposphere, CH4
is removed mainly by reaction with the OH radical. Therefore, a higher OH concentration
will lead to more rapid removal of CH4 from the
atmosphere. Table 4-5 presents the chemical lifetime
of CH4 and changes from aircraft emissions for
scenarios A-F. The lifetime in Table 4-5 is defined
as the CH4 amount up to 300 hPa divided by the
amount annually destroyed by chemical processes. There are large differences
in CH4 lifetimes calculated by the models for
base cases A, C, and E. It is beyond the scope of this report to assess what
causes these differences, but it can be generally said that global OH is very
sensitive to photolysis rates, parameterization of lightning NOx
emissions, and the amount and distribution of surface NOx
and other emissions. Comparing simulations A, C, and E, which show enhancements
from changes in surface emissions, CH4 lifetimes
increase by 0.5-3.2% from 1992 to 2015 and by 7-12% from 1992 to 2050. The decrease
of OH concentrations is a result of the strong effect of anthropogenic CO emissions
and higher background CH4 concentrations, which
dominate the effect of surface emissions of NOx.
The models are rather consistent in their estimates of changes of CH4
lifetimes from aircraft emissions. Comparing simulations with and without aircraft
emissions, CH4 lifetimes are calculated to decrease
globally by 1.2-1.5% in 1992, 1.6-2.9% in 2015, and 2.3-4.3% in 2050.
Changes in calculated CH4 lifetime from aircraft
emissions for the three time periods considered are surprisingly similar in
the model studies. With the exception of the ECHAm3/CHEM model, which
gives smaller perturbations than the other models because it uses a fixed mixing
ratio boundary condition for CO, the differences among models for aircraft impacts
are within 20%. This perturbation of CH4 residence
time from aircraft emissions is significantly larger than that obtained in previous
studies (IPCC, 1995; Fuglestvedt et al., 1996) using 2-D models. CH4
loss is dominated by OH changes in the tropical and subtropical regions of the
lower troposphere. These previous studies showed OH changes that were largely
restricted to the UT, where OH perturbations have little impact on CH4
residence time. Figure 4-5a shows the perturbation
in the zonally averaged OH field (July) for 2015 aircraft emissions (given in
106 molecules/cm-3) from the UiO model. The figure shows that the
perturbations extend well into the lower troposphere at most latitudes in the
Northern Hemisphere. One explanation for this result could be that CO, which
accounts for most of the OH loss, has a sufficiently long lifetime to be transported
over large distances. The impact on CO in one region could influence CO (Figure
4-5b) and OH in other regions (e.g., low-latitude lower troposphere), leading
to the estimated impact on CH4. Similar CO changes
were found, for example, in the Tm3/ KNMI model. In addition to changes
in CO, relatively small O3 changes are predicted
in the warm humid tropics. These changes also lead to somewhat increased OH
production, hence a decrease in CH4 lifetime.
Thus, changes in CH4 lifetime are related in
direct and indirect ways to changes in O3 concentrations
and probably should be assessed together. The difference in estimated residence
time compared with previous 2-D studies could therefore be a result of very
different transport parameterizations in 2-D and 3-D models.
Table 4-5: Chemical lifetime (in years) of methane [columns
A, C, and E] up to 300 hPa (~10 km) and changes of this lifetime (%) (columns
B, D, and F) by including aircraft emissions (nc = not calculated).
|
|
|
| Model |
A
|
B
|
C
|
D
|
E
|
F
|
| |
|
|
|
|
|
|
| IMAGES/BISAa |
6.60
|
-1.2%
|
6.81
|
-2.6%
|
7.36
|
-3.7%
|
| ECHAm3/CHEM |
nc
|
nc
|
6.46
|
-1.6%
|
6.51
|
-2.3%
|
| HARVARD |
9.33
|
-1.2%
|
9.43
|
-2.6%
|
nc
|
nc
|
| UiO |
8.52
|
-1.3%
|
8.59
|
-2.6%
|
9.48
|
-3.9%
|
| UKMOb |
10.52
|
-1.5%
|
10.69
|
-2.9%
|
11.26
|
-4.3%
|
| Tm3/KNMI |
8.97
|
-1.4%
|
|
-2.6%
|
|
-3.5%
|
|
|
a Uses fixed lower boundary conditions for CO.
b Lifetime up to 100 hPa; a lower lifetime is expected for integration
up to 300 hPa. |
|
Table 4-6:Relative sensitivity (%) of global ozone perturbations
from aircraft emissions.
|
Sensitivity
Case |
IMAGES/
BISA |
ECHAm3/
CHEM |
Tm3/
KNMI |
UiO |
| |
|
|
|
|
| Lightning |
|
|
|
-16 |
| |
|
|
|
|
Surface
emissions IS92a |
|
|
|
-11 |
| |
|
|
|
|
| NASA-ANCAT |
|
-20 |
|
|
| |
|
|
|
|
| NMHC chemistry |
-35 |
|
-10 |
|
| |
|
|
|
|
Exclusion of N2O5
removal on aerosol |
-10 |
|
0 |
|
| |
|
|
|
|
| Interannual variability |
|
±6.3 |
|
|
| |
|
|
|
|
| Scenario G - F |
|
|
|
+44 |
|
|
The reduction in CH4 lifetime would lead to a nearly uniform CH4 reduction
globally because of the relatively long residence time computed for CH4. This
result would be in contrast to O3, for which changes would occur on large regional
scales. Finally, it should be noted that for computational reasons, the experiments
in this assessment were performed using fixed CH4 concentrations at the Earth's
surface (see Section 4.2.2.1), and CH4 concentrations
at the surface were not allowed to adapt to higher OH abundances (positive feedback).
Hence, even larger CH4 decreases are to be expected if CH4 ground flux boundary
conditions are used. However, such calculations are much more computationally
intensive. IPCC (1995) and Fuglestvedt et al. (1996) showed that the feedback
factor is uncertain and model-dependent but is estimated to be in the range
1.2-1.5. Adopting a factor of 1.4 increases the percentage changes, in the CH4
lifetimes shown in Table 4-5, to -2.2 to -4.1% in
2015 and -3.2 to -6.0% in 2050. Changes in CH4 lifetime of this order will lead
to global average radiative forcing (see Chapter 6) similar
to global average radiative forcing perturbations from aircraft-induced O3 changes,
but with an opposite sign (CH4 will be reduced).
4.2.3.5. Sensitivity Studies
|
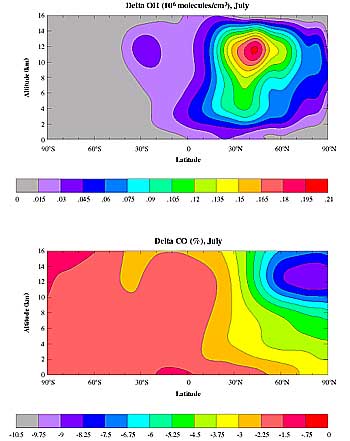
Figure 4-5: Zonally and monthly averaged change in concentration of OH (106 molecules/cm3)
and CO (%) in July as a result of emissions from aircraft in 2015, calculated by the UiO model.
|
In this section, we focus on a limited set of sensitivity studies that help
define the uncertainty range of the model calculations. Ideally, a large number
of simulations should have been performed by all the participating models. However,
only a limited number of model simulations was possible because of time constraints
and the demand of computer resources for 3-D CTM studies. Therefore, only one
or two models have performed each of the sensitivity studies. Also, some uncertainties
cannot be addressed properly. For example, modeled upper tropospheric and lower
stratospheric NOx and NOy concentrations are extremely uncertain and are difficult
to compare to measurements because of large temporal and spatial variations
and a limited number of observations (see Chapter 2).
There may be additional uncertainties from unknown processes that feed back
on increases in NOx and O3 in a future modified atmosphere.
The sensitivity studies focus on the impact on O3. The following studies were
performed:
Sensitivity of aircraft-induced O3 perturbations to background NOx levels
from lightning. This finding is obtained by increasing global average NOx
production from 5 Tg N yr-1, which is used in the reference case, to 12 Tg
N yr-1. The same spatial distribution is used in both cases.
Sensitivity of O3 perturbation to different regional growth in emissions.
In the base case (IS92a), a uniform growth rate was used for the surface emission
of pollutants. The sensitivity run was performed with the same global growth
rate as in the base case but with the different regional growth rates given
in Table 4-3.
Sensitivity to different projections of aircraft emissions. Instead of NASA
2015 emissions, the ANCAT-2015 aircraft emission data set was used. Total
ANCAT emissions for the year 2015 are about 15% larger than the NASA emissions
(see Section 9.3.4). Further differences relate to
the location and seasonal variations of emissions.
Sensitivity to inclusion of NMHC chemistry. This study was conducted by making
runs in which NMHC chemistry was excluded and comparing the results with those
in which NMHC chemistry was included.
Sensitivity to neglecting heterogeneous chemistry on background sulfate aerosols.
This sensitivity was estimated by comparing results with and without the heterogeneous
nitrogen pentoxide (N2O5) + H2O reaction on aerosol. The aerosol surface area
was derived from model calculations of the sulfur cycle. Hydrolysis of N2O5
on wet aerosol converts active NOx into the reservoir species HNO3, which
is effectively removed by rain out. Hence, in the base case, less NOy is present
in the free troposphere and LS, and emissions by aircraft are more effective
in producing O3.
Sensitivity to interannual variability in meteorology.
Sensitivity to uncertainty in emissions in 2050. This study is carried out
by using scenario G instead of scenario F from Table
4-4. Total NOx emission changes from 2 to 3.5 Tg N yr-1.
Table 4-7: Models that contributed results to this report.
|
| Model Name |
Institution |
Model Team |
| 2-D Models |
|
|
| AER |
Atmospheric and Environmental Research, Inc., USA |
Malcolm Ko, Debra Weisenstein, Courtney
Scott, Jose Rodriguez, Run-Lie Shia, N.D |
| |
|
|
| Sze |
|
|
| |
|
|
| CSIRO |
Commonwealth Scientific and Industrial Research
Organization Telecommunications and Industrial
Physics, Australia |
Keith Ryan, Ian Plumb, Peter Vohralik,
Lakshman Randeniya |
| |
|
|
GSFC
Fleming |
NASA Goddard Space Flight Center, USA |
Charles Jackman, David Considine, Eric |
| |
|
|
LLNL
Grant, |
Lawrence Livermore National Laboratory, USA |
Douglas Kinnison, Peter Connell, Keith
Douglas Rotman |
| |
|
|
| THINAIR |
University of Edinburgh, UK |
Robert Harwood, Vicky West |
| |
|
|
| UNIVAQ |
University of L'Aquila, Italy |
Giovanni Pitari, Barbara Grassi, Lucrezia
Ricciardulli, Guido Visconti |
| |
|
|
| 3-D Models |
|
|
| LARC |
NASA Langley Research Center, USA |
William Grose, Richard Eckman |
| |
|
|
| SCTM1 |
University of Oslo, Norway |
Michael Gauss, Ivar Isaksen |
| |
|
|
| SLIMCAT |
University of Cambridge, UK |
Helen Rogers, Martyn Chipperfield |
|
|
The results of the sensitivity studies are presented in Table
4-6. The table presents the relative sensitivity r (%) of each process by
comparing aircraft-induced increases in global O3 for the base case and the
sensitivity case:
| r = [(O3,2-O3,1)/O3,1]*100% |
(1) |
|
2
The model results presented in this chapter are a summary
of muchmodel output. Supplemental material regarding the effects of supersonic
aircraft are retrievable over the Internet. Supersonic model simulation
information includes figures, tables, and text and is available at a NASA
Langley Research Center computer until 31 December 2000:
Host: uadp1.larc.nasa.gov
Username: anonymous
Password: your e-mail address
Directory: IPCC_TECH_REPORTS/supersonic
Information concerning supersonic model simulations may
also be viewed (retrieved) over the Web by going to the following URL: ftp://uadp1.larc.nasa.gov/IPCC_TECH_REPORTS/supersonic/.
|
where O3,1 is the global O3 increase (kg) up to 16 km for the base case in
2015 (i.e., scenario D-C) and O3,2 is the same increase calculated for the sensitivity
study (i.e., scenario D'-C'). The sensitivity studies show that increases in
background NOx from lightning (sensitivity study 1) and different growth rates
in surface emissions in different regions (sensitivity study 2) have only a
slight impact on O3 perturbation from aircraft
emissions. In both cases, O3 perturbations are reduced. This finding shows
that O3 production in the UT and LS is limited by NOx, rather than by hydrocarbons.
Interannual variability in meteorology (sensitivity study 6) and exclusion of
heterogeneous removal of N2O5 in the models also led to a small change in global
average O3 perturbation (sensitivity study 5). Excluding hydrocarbon chemistry
(sensitivity study 4) would have a significant impact on O3, resulting in a
smaller perturbation. Furthermore, there were significant differences in the
results between the two models used to perform the study. Comparison of results
with two different emission scenarios (sensitivity study 3) showed a noticeable
impact on global O3 perturbation. Sensitivity study 7, which was set up to test
the response of O3 perturbation to greatly increased NOx emission from aircraft
(estimated upper limit in 2050), showed that the response is nearly linear and
similar to what is computed for smaller NOx perturbations.
It should be noted that the comparisons in Table 4-6
are made for global average O3 perturbations; sensitivities are larger on regional
and seasonal scales.
|