|
6.6. The Role of Aircraft in Climate Change-Evaluation of Sample Scenarios
|
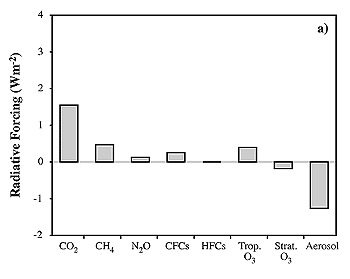
Figure 6-14a: Bar charts of radiative forcing from all perturbations
in 1990 (from IPCC, 1996).
Note scale change from (a) to (b). In (b), best estimate (bars) and high-low 67%
probability intervals (whiskers) are given. No best estimate is shown for the
cirrus clouds; rather, the dashed line indicates a range of possible estimates.
The evaluations below the graph are relative appraisals of the level of
scientific understanding associated with each component.
|
|
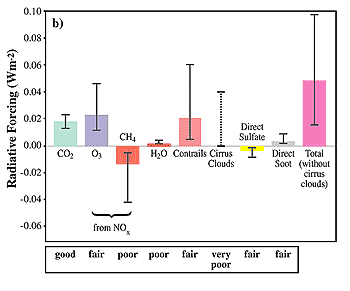
Figure 6-14b: Bar charts of radiative forcing from
aviation effects in 1992. Note scale change from (a) to (b). In (b),
best estimate (bars) and high-low 67% probability intervals (whiskers)
are given. No best estimate is shown for the cirrus clouds; rather, the
dashed line indicates a range of possible estimates. The evaluations below
the graph are relative appraisals of the level of scientific understanding
associated with each component.
|
The overall impact of aviation on climate change in the next 50 years is evaluated
here for a range of scenarios (see Section 6.1.3 and Table
6-3) in air traffic and potential options in civil aviation (e.g., low-NOx
combustors, high-speed civil transport). Aviation's role is considered within
the context of climate change already being forced by greenhouse gases and expected
to continue from growth of the world's economies (e.g., IPCC's IS92a scenario;
see IPCC, 1992). The impact of air travel and climate change as a whole on society
is beyond this scientific assessment of the role of aviation in physical climate
change.
This section combines the aviation impacts from Sections
6.3 and 6.4 evaluated for the fixed-year scenarios
(defined in Table 6-1) and places them in a continuous
time sequence (defined in Table 6-3) to compare
with overall climate changes expected under IS92a. We assume that RFs are additive,
so the issue of different climate sensitivities-for example, for aircraft-induced
ozone perturbations versus those from co2 (as discussed in Section
6.5)-introduces some additional error/ uncertainty when we use summed RF
to deduce climate change. We have no alternative but to use RF as a metric of
climate change because differences in forcing between the various subsonic options
would not be reliably detected above the natural climate variability in many
models. The summed RF, however, should provide a relative ranking of the different
options discussed below.
6.6.1. Individual Components of Radiative Forcing
Figure 6-14a (IPCC, 1996) shows a bar chart of
individual components of RF for all anthropogenic change for the 1990 atmosphere.
This figure can be compared with 1992 aircraft RF components from the NASA-1992*
scenario in Figure 6-14b (note the change of scale;
see also Table 6-1). Aircraft RF is qualitatively
different from overall anthropogenic RF: The CH4 RF is
negative, the O3-RF is greater than the co2-RF,
and the aerosol-cloud effects are positive (because of persistent contrails)
rather than negative. Within the error bars, the effects of co2,
O3, and contrails are comparable; that of methane is
also comparable, but negative. A caveat here is that we are unable to derive
a best estimate for the indirect effects from aircraft on "natural" clouds;
these effects might be negligible or may be comparable to that of contrails.
Thus, for 1992 our best estimate is that aviation causes RF (without additional
cirrus) of approximately +0.05 W m-2 and is responsible
for about 3.5% of the total anthropogenic RF of about +1.4 W m-2
for greenhouse gases plus aerosols (+2.7 W m-2 for greenhouse
gases alone).
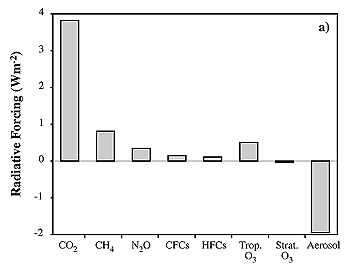
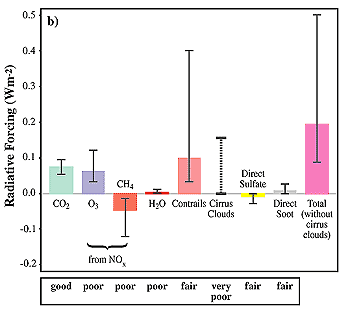
Bar charts for the 2050 atmosphere are presented in Figure
6-15a. The same qualitative differences apply. However, in 2050 the contribution
by contrails is almost twice as large as the contribution from aircraft co2
or O3. Thus, in 2050 for the Fa1 scenario, our best estimate
is that aviation RF (without additional cirrus) grows to about +0.19 W m-2,
which is 5% of the total anthropogenic radiative forcing anticipated for IS92a
of +3.8 W m-2 for greenhouse gases plus aerosols (+5.8
W m-2 for greenhouse gases alone). This fraction is more
than doubled for E-type scenarios (Table 6-1). There
is considerable scientific uncertainty in these estimates-a factor of 2 or more
at the 67% confidence level-that is separate from the potential error in projecting
future scenarios for aviation and IS92a.
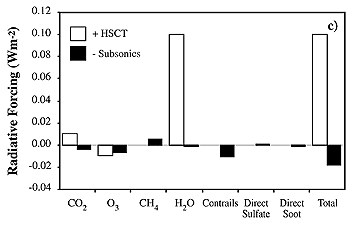
Individual RF components in 2050 attributable to the impact of adding a supersonic
fleet are shown in Figure 6-15c (see also Table
6-1). The white bars denote the direct RF of HSCTs; the black bars denote
the RF from displaced subsonic air traffic. As already discussed, RF from stratospheric
H2O contributes the largest component, comparable in magnitude to the big three
RFs CO2, O3, contrails) from
the subsonic fleet (Figure 6-15b). RFs for the
combined fleet (Fa1H) are listed separately in Tables
6-1 and 6-2.
|
|
|
|
|
|
Figure 6-15: Bar charts of radiative forcing in 2050
(a) from all perturbations (from IPCC, 1996), (b) from subsonic aviation
(Fa1), and (c) from the additional effect due to supersonic air traffic.
Note scale change from (a) to (b) and (c). In (b), best estimate (bars) and
high-low 67% probability intervals (whiskers) are given. No best estimate
is shown for cirrus clouds; rather, the dashed line indicates a range of
possible estimates. The evaluations below the graph are relative appraisals
of the level of scientific understanding associated with each component. In
(c), white bars denote the direct effect of the supersonic fleet (HSCT1000),
whereas the black bars display the change resulting from the displaced subsonic
air traffic.
|
|