|
7.2.2 Aircraft Historical and Future Developments
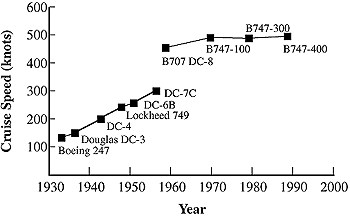
The cruise speed of 1940s propeller-driven aircraft increased from about 100
to 300 knots over a period of 20 years, as shown in Figure
7-1 for Boeing and Douglas aircraft (Condit, 1996). At the start of the
commercial jet age, at the end of the 1950s, cruise speeds were about 450 knots.
The majority of turbofan-powered aircraft in today's world fleet have average
cruise speeds of about 500 knots (Jane's, 1998).
|

Figure 7-1: Transport aircraft cruise speed progress.

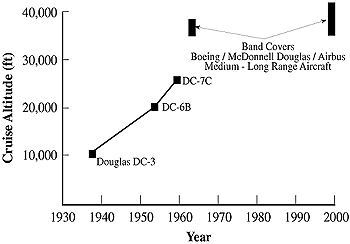
Figure 7-2: Transport aircraft cruise altitude progress

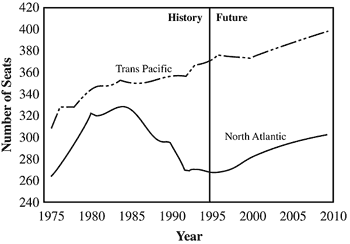
Figure 7-3: Average airplane size.
|
Airworthiness requirements determine the range of safe operational speeds for
a given aircraft type. Actual speeds for any given flight will be determined
by air traffic control considerations and by individual airline performance
management system techniques, the latter taking due account of the need for
fuel efficiency. These operational aspects are discussed in Chapter
8.
In the period mentioned above, the cruise altitudes of propeller driven aircraft
have risen from about 3 to about 7.5 km, as shown in Figure
7-2. For longer range jet- and turbofan-powered aircraft, average cruise
altitudes have remained fairly constant over the past 35 years at 10.5 to 11.5
km, although, since the initial turbofan-powered aircraft were designed, there
has been a slow rise in maximum cruise capability. Some aircraft can cruise
up to about 13 km. Aircraft will sometimes fly below optimum design cruise altitudes
for reasons associated with air traffic control or severe weather conditions
(storms and clear air turbulence). Flying at lower cruise altitudes can significantly
increase fuel burn (see Chapter 8) depending on range
and passenger load.
The civil aircraft fleet average for speed and cruise altitude is not expected
to increase significantly beyond 500 knots and 13 km over the next 50 years,
as a result of physical and cost limitations. The high cost of developing new
aircraft has led to the adaptation of baseline designs to increase payload and
range. Increased weight generally requires more thrust, which can mean using
new engines or increasing the performance of existing engines using the "throttle
push" approach (described in Section 7.5). Aircraft range
has increased from the B707 era (~5,000 nm) to today's long-range (~8,000+ nm)
aircraft such as the A340 and the B777.Longer range flights will need to take
account of additional passenger amenities such as sleeping facilities. There
is little doubt that operational pressures will ensure that existing baseline
designs will continue to be developed to achieve further increases in range
and payload. Average aircraft size has increased steadily over the transpacific
region over the past 20 years, with an associated rise in the numbers of passengers.
This route and North Atlantic routes are expected to increase in the future
(see Figure 7-3) (Boeing, 1996). For domestic travel,
however, shorter range designs with a larger payload can provide benefits in
fuel efficiency.
7.2.3. Time Scales from Technology Development to End of Service Life
The rates at which new aircraft designs and derivatives of current products
enter the commercial fleet vary across the range of aircraft size and missions.
Progress in airframe and engine technology has an important effect on the time
scales over which aircraft mature; so do economic and customer requirements.
The implementation of improved technology is limited, however, by the number
of opportunities arising for new aircraft projects or major derivatives of existing
designs. In some cases, improvements are introduced singularly. In others, combinations
of improvements are introduced. Thus, in one case a new airframe might utilize
an existing engine (DC-10/CF6-50), whereas in another a new engine might be
applied to an existing airframe (A310/JT9D and PW4000). In some cases, changes
are at the component level, the B757-300 using the RB211-535E4 LEC (low emissions
combustor) engine and the A320 using the CFM 56-5B(DAC) (double annular combustor).
The B777/GE90, on the other hand, represents an example of an all new airframe/engine/combustor
technology combination.
There is a considerable period of time between the start of a preliminary design
of a new or derivative aircraft and the delivery of that aircraft to a "launch"
airline. This period includes extensive testing and certification of new equipment.
Production rates and aircraft life cycle then determine the time that the aircraft
series will remain in the fleet.
A typical time-history for a medium-range commercial aircraft from technology
development to the end of airline service life would be as follows:
- Technology development preliminary/final design through aircraft certification
testing = 5-10 years
- Successful production run = 15-20 years
- Aircraft lifetime = 25-35 years
- Total time span (i) through (iii) to retirement of aircraft series = 45-65
years
- Time span (ii) through (iii) to retirement of aircraft series = 40-55 years
7.2.4. Summary of Aircraft Fuel Efficiency Improvements
Significant improvements in aircraft fuel efficiency have been achieved since
the dawn of the jet age in commercial aviation. Historically, these improvements
have averaged 1-2% per year for new production aircraft (Koff, 1991; Albritton
et al., 1996; Condit, 1996). These advances have been achieved through incorporation
of new engine and airframe technology. Changes have included incremental and
large-scale improvements. Examined over several decades, however, they represent
a relatively steady and continuous rate of improvement. A similar trend is assumed
when fuel efficiency improvements are projected forward to 2050.
Table 7-1:Percentage production fuel-efficiency
improvements (ASK kg-1 fuel).
|
| Time Period |
Airframe |
Propulsion |
Total Aircraft |
| 1950-1997 |
30 |
40 |
70a |
| 1997-2015b |
10 |
10 |
20 |
| 1997-2050 |
25 |
20 |
45 (40-50)c |
a) To date, approximately 3/7 of the total fuel efficiency improvement of
70% is attributable to advances in airframe technology.
b) Based on improvement records to date and the discussion in Section
7.3.7, it is reasonable to expect an airframe production average fuel-efficiency
improvement of ~10% by 2015. This percentage improvement is further substantiated
in other reference material (Greene, 1995). Similarly, a 10% propulsion
production average fuel-efficiency improvement is considered feasible
in this time frame.
c) In the longer term (2050) compared to 1997, a total aircraft production
average fuel-efficiency improvement of 40-50% is considered feasible (ICCAIA,
1997g). These levels of efficiency improvement are assumed in the 2050
technology scenarios described in Chapter 9. The
ratio of airframe to propulsion production average fuel-efficiency improvement
over the period 1997 to 2050 is projected to be 55/45 in favor of airframe
technology developments. This is equivalent to a 25% airframe fuel-efficiency
improvement.
|
|
Aircraft, airframe, and propulsion production fuel efficiency improvements
from the 1950s to today and projected to 2015 and 2050 are summarized in Table
7-1.
Chapter 9 addresses the development of equivalent projected
(2015/2050) fleet fuel efficiency improvements from production average fuel
efficiencies used in emission scenarios.
Airframe and engine improvements are discussed in detail in Sections
7.3 and 7.4.
|