B. The Observed Changes in the Climate System
Is the Earth's climate changing? The answer is unequivocally "Yes".
A suite of observations supports this conclusion and provides insight about the
rapidity of those changes. These data are also the bedrock upon which to construct
the answer to the more difficult question: "Why is it changing?", which
is addressed in later Sections.
This Section provides an updated summary of the observations that delineate
how the climate system has changed in the past. Many of the variables of the
climate system have been measured directly, i.e., the "instrumental record".
For example, widespread direct measurements of surface temperature began around
the middle of the 19th century. Near global observations of other surface "weather"
variables, such as precipitation and winds, have been made for about a hundred
years. Sea level measurements have been made for over 100 years in some places,
but the network of tide gauges with long records provides only limited global
coverage. Upper air observations have been made systematically only since the
late 1940s. There are also long records of surface oceanic observations made
from ships since the mid-19th century and by dedicated buoys since about the
late 1970s. Sub-surface oceanic temperature measurements with near global coverage
are now available from the late 1940s. Since the late 1970s, other data from
Earth-observation satellites have been used to provide a wide range of global
observations of various components of the climate system. In addition, a growing
set of palaeoclimatic data, e.g., from trees, corals, sediments, and ice, are
giving information about the Earth's climate of centuries and millennia
before the present.
This Section places particular emphasis on current knowledge of past changes
in key climate variables: temperature, precipitation and atmospheric moisture,
snow cover, extent of land and sea ice, sea level, patterns in atmospheric and
oceanic circulation, extreme weather and climate events, and overall features
of the climate variability. The concluding part of this Section compares the
observed trends in these various climate indicators to see if a collective picture
emerges. The degree of this internal consistency is a critical factor in assessing
the level of confidence in the current understanding of the climate system.
B.1 Observed Changes in Temperature
Temperatures in the instrumental record for land and oceans
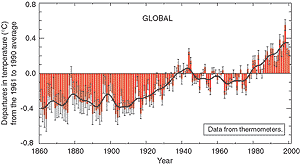
The global average surface temperature has increased by 0.6 ± 0.2°C3
since the late 19th century. It is very likely that the 1990s was the warmest
decade and 1998 the warmest year in the instrumental record since 1861 (see Figure
2). The main cause of the increased estimate of global warming of 0.15°C
since the SAR is related to the record warmth of the additional six years (1995
to 2000) of data. A secondary reason is related to improved methods of estimating
change. The current, slightly larger uncertainty range (±0.2°C, 95%
confidence interval) is also more objectively based. Further, the scientific basis
for confidence in the estimates of the increase in global temperature since the
late 19th century has been strengthened since the SAR. This is due to the improvements
derived from several new studies. These include an independent test of the corrections
used for time-dependent biases in the sea surface temperature data and new analyses
of the effect of urban "heat island" influences on global land-temperature
trends. As indicated in Figure 2, most of the increase
in global temperature since the late 19th century has occurred in two distinct
periods: 1910 to 1945 and since

Figure 2: Combined annual land-surface air and sea surface temperature
anomalies (°C) 1861 to 2000, relative to 1961 to 1990. Two standard
error uncertainties are shown as bars on the annual number. [Based on Figure
2.7c] |


Figure 3: Annual temperature trends for the periods 1901 to 1999,
1910 to 1945, 1946 to 1975 and 1976 to 1999 respectively. Trends are represented
by the area of the circle with red representing increases, blue representing
decreases, and green little or no change. Trends were calculated from annually
averaged gridded anomalies with the requirement that the calculation of
annual anomalies include a minimum of 10 months of data. For the period
1901 to 1999, trends were calculated only for those grid boxes containing
annual anomalies in at least 66 of the 100 years. The minimum number of
years required for the shorter time periods (1910 to 1945, 1946 to 1975,
and 1976 to 1999) was 24, 20, and 16 years respectively. [Based on Figure
2.9] |
1976. The rate of increase of temperature for both periods is about 0.15°C/decade.
Recent warming has been greater over land compared to oceans; the increase in
sea surface temperature over the period 1950 to 1993 is about half that of the
mean land-surface air temperature. The high global temperature associated with
the 1997 to 1998 El Niño event stands out as an extreme event, even taking
into account the recent rate of warming.
The regional patterns of the warming that occurred in the early part of
the 20th century were different than those that occurred in the latter part.
Figure 3 shows the regional patterns of the warming
that have occurred over the full 20th century, as well as for three component
time periods. The most recent period of warming (1976 to 1999) has been almost
global, but the largest increases in temperature have occurred over the mid-
and high latitudes of the continents in the Northern Hemisphere. Year-round
cooling is evident in the north-western North Atlantic and the central North
Pacific Oceans, but the North Atlantic cooling trend has recently reversed.
The recent regional patterns of temperature change have been shown to be related,
in part, to various phases of atmospheric-oceanic oscillations, such as the
North Atlantic-Arctic Oscillation and possibly the Pacific Decadal Oscillation.
Therefore, regional temperature trends over a few decades can be strongly influenced
by regional variability in the climate system and can depart appreciably from
a global average. The 1910 to 1945 warming was initially concentrated in the
North Atlantic. By contrast, the period 1946 to 1975 showed significant cooling
in the North Atlantic, as well as much of the Northern Hemisphere, and warming
in much of the Southern Hemisphere.
New analyses indicate that global ocean heat content has increased significantly
since the late 1950s. More than half of the increase in heat content has
occurred in the upper 300 m of the ocean, equivalent to a rate of temperature
increase in this layer of about 0.04°C/decade.
New analyses of daily maximum and minimum land-surface temperatures for
1950 to 1993 continue to show that this measure of diurnal temperature range
is decreasing very widely, although not everywhere. On average, minimum
temperatures are increasing at about twice the rate of maximum temperatures
(0.2 versus 0.1°C/decade).
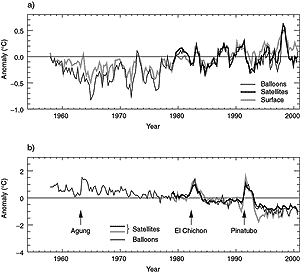
Temperatures above the surface layer from satellite and weather balloon records
Surface, balloon and satellite temperature measurements show that the troposphere
and Earth's surface have warmed and that the stratosphere has cooled. Over
the shorter time period for which there have been both satellite and weather balloon
data (since 1979), the balloon and satellite records show significantly less lower-tropospheric
warming than observed at the surface. Analyses of temperature trends since
1958 for the lowest 8 km of the atmosphere and at the surface are in good agreement,
as shown in Figure 4a, with a warming of about 0.1°C
per decade. However, since the beginning of the satellite record in 1979, the
temperature data from both satellites and weather balloons show a warming in the
global middle-to-lower troposphere at a rate of approximately 0.05 ± 0.10°C
per decade. The global average surface temperature has increased significantly
by 0.15 ± 0.05°C/decade. The difference in the warming rates is statistically
significant. By contrast, during the period 1958 to 1978, surface temperature
trends were near zero, while trends for the lowest 8 km of the atmosphere were
near 0.2°C/decade. About half of the observed difference in warming since
1979 is likely4
to be due to the combination of the differences in spatial coverage of the surface
and tropospheric observations and the physical effects of the sequence of volcanic
eruptions and a substantial El Niño (see Box 4 for a general description
of ENSO) that occurred within this period. The remaining difference is very likely
real and not an observing bias. It arises primarily due to differences in the
rate of temperature change over the tropical and sub-tropical regions, which were
faster in the lowest 8 km of the atmosphere before about 1979, but which have
been slower since then. There are no significant differences in warming rates
over mid-latitude continental regions in the Northern Hemisphere. In the upper
troposphere, no significant global temperature trends have been detected since
the early 1960s. In the stratosphere, as shown in Figure
4b, both satellites and balloons show substantial cooling, punctuated by sharp
warming episodes of one to two years long that are due to volcanic eruptions.
Surface temperatures during the pre-instrumental period from the proxy record
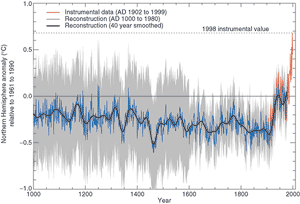
It is likely that the rate and duration of the warming of the 20th century
is larger than any other time during the last 1,000 years. The 1990s are likely
to have been the warmest decade of the millennium in the Northern Hemisphere,
and 1998 is likely to have been the warmest year. There has been a considerable
advance in understanding of temperature change that occurred over the last millennium,
especially from the synthesis of individual temperature reconstructions. This
new detailed temperature record for the Northern Hemisphere is shown in Figure
5. The data show a relatively warm period associated with the 11th to 14th
centuries and a relatively cool period associated with the 15th to 19th centuries
in the Northern Hemisphere. However, evidence does not support these "Medieval
Warm Period" and "Little Ice Age" periods, respectively, as being
globally synchronous. As Figure 5 indicates, the
rate and duration of warming of the Northern Hemisphere in the 20th century
appears to have been unprecedented during the millennium, and it cannot simply
be considered as a recovery from the "Little Ice Age" of the 15th
to 19th centuries. These analyses are complemented by sensitivity analysis of
the spatial representativeness of available palaeoclimatic data, indicating
that the warmth of the recent decade is outside the 95% confidence interval
of temperature uncertainty, even during the warmest periods of the last millennium.
Moreover, several different analyses have now been completed, each suggesting
that the Northern Hemisphere temperatures of the past decade have been warmer
than any other time in the past six to ten centuries. This is the time-span
over which temperatures with annual resolution can be calculated using hemispheric-wide
tree-ring, ice-cores, corals, and and other annually-resolved proxy data. Because
less data are available, less is known about annual averages prior to 1,000
years before the present and for conditions prevailing in most of the Southern
Hemisphere prior to 1861.
It is likely that large rapid decadal temperature changes occurred during
the last glacial and its deglaciation (between about 100,000 and 10,000 years
ago), particularly in high latitudes of the Northern Hemisphere. In a few
places during the deglaciation, local increases in temperature of 5 to 10°C
are likely to have occurred over periods as short as a few decades. During the
last 10,000 years, there is emerging evidence of significant rapid regional
temperature changes, which are part of the natural variability of climate.

Figure 4: (a) Time-series of seasonal temperature anomalies of the
troposphere based on balloons and satellites in addition to the surface.
(b) Time-series of seasonal temperature anomalies of the lower stratosphere
from balloons and satellites. [Based on Figure
2.12] |

Figure 5: Millennial Northern Hemisphere (NH) temperature reconstruction
(blue – tree rings, corals, ice cores, and historical records) and instrumental
data (red) from AD 1000 to 1999. Smoother version of NH series (black),
and two standard error limits (gray shaded) are shown. [Based on Figure
2.20] |
|

