| Working Group I: The Scientific Basis |
| Working Group I: The Scientific Basis |
|
|
|
| Other reports in this collection | |
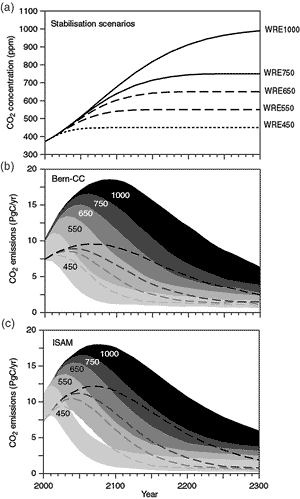
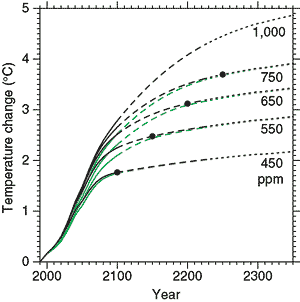
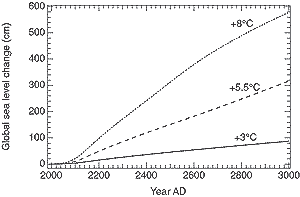
All of the stabilisation profiles studied require CO2 emissions to eventually drop well below current levels. Anthropogenic CO2 emission rates that arrive at stable CO2 concentration levels from 450 to 1,000 ppm were deduced from the prescribed CO2 profiles (Figure 25a). The results (Figure 25b) are not substantially different from those presented in the SAR; however, the range is larger, mainly due to the range of future terrestrial carbon uptake caused by different assumptions in the models. Stabilisation at 450, 650 or 1,000 ppm would require global anthropogenic emissions to drop below 1990 levels within a few decades, about a century, or about two centuries, respectively, and continue to steadily decrease thereafter. Although there is sufficient uptake capacity in the ocean to incorporate 70 to 80% of foreseeable anthropogenic CO2 emissions to the atmosphere, this process takes centuries due to the rate of ocean mixing. As a result, even several centuries after emissions occurred, about a quarter of the increase in concentration caused by these emissions is still present in the atmosphere. To maintain constant CO2 concentration beyond 2300 requires emissions to drop to match the rate of carbon sinks at that time. Natural land and ocean sinks with the capacity to persist for hundreds or thousands of years are small (<0.2 PgC/yr). Temperature Global mean temperature continues to increase for hundreds of years at a rate of a few tenths of a degree per century after concentrations of CO2 have been stabilised, due to long time-scales in the ocean. The temperature implications of CO2 concentration profiles leading to stabilisation from 450 ppm to 1,000 ppm were studied using a simple climate model tuned to seven AOGCMs with a mean climate sensitivity of 2.8°C. For all the pathways leading to stabilisation, the climate system shows considerable warming during the 21st century and beyond (see Figure 26). The lower the level at which concentrations stabilise, the smaller the total temperature change.Sea level If greenhouse gas concentrations were stabilised (even at present levels), sea level would nonetheless continue to rise for hundreds of years. After 500 years, sea level rise from thermal expansion may have reached only half of its eventual level, which models suggest may lie within a range of 0.5 to 2.0 m and 1 to 4 m for CO2 levels of twice and four times pre-industrial, respectively. The long time-scale is characteristic of the weak diffusion and slow circulation processes that transport heat into the deep ocean. The loss of a substantial fraction of the total glacier mass is likely. Areas that are currently marginally glaciated are most likely to become ice-free. Ice sheets will continue to react to climatic change during the next several thousand years, even if the climate is stabilised. Together, the present Antarctic and Greenland ice sheets contain enough water to raise sea level by almost 70 m if they were to melt, so that only a small fractional change in their volume would have a significant effect. Models project that a local annual average warming of larger than 3°C, sustained for millennia, would lead to virtually a complete melting of the Greenland ice sheet with a resulting sea level rise of about 7 m. Projected temperatures over Greenland are generally greater than globally averaged temperatures by a factor of 1.2 to 3.1 for the range of models used in Chapter 11. For a warming over Greenland of 5.5°C, consistent with mid-range stabilisation scenarios (see Figure 26), the Greenland ice sheet is likely to contribute about 3 m in 1,000 years. For a warming of 8°C, the contribution is about 6 m, the ice sheet being largely eliminated. For smaller warmings, the decay of the ice sheet would be substantially slower (see Figure 27). Current ice dynamic models project that the West Antarctic ice sheet (WAIS) will contribute no more than 3 mm/yr to sea level rise over the next thousand years, even if significant changes were to occur in the ice shelves. Such results are strongly dependent on model assumptions regarding climate change scenarios, ice dynamics and other factors. Apart from the possibility of an internal ice dynamic instability, surface melting will affect the long-term viability of the Antarctic ice sheet. For warmings of more than 10ºC, simple runoff models predict that a zone of net mass loss would develop on the ice sheet surface. Irreversible disintegration of the WAIS would result because the WAIS cannot retreat to higher ground once its margins are subjected to surface melting and begin to recede. Such a disintegration would take at least a few millennia. Thresholds for total disintegration of the East Antarctic ice sheet by surface melting involve warmings above 20ºC, a situation that has not occurred for at least 15 million years and which is far more than predicted by any scenario of climate change currently under consideration.
|
|
Other reports in this collection |