7.2.2.5 Representation of cloud processes in models
Over the last 10 years, the generalised availability of satellite retrievals
(OLR, water path, cloud cover, cloud top temperature) has strongly increased
the possibility of assessing clouds simulated by climate models, in spite of
remaining uncertainties concerning the vertical structure of the cloud systems,
of large importance for all feedback effects. Yet this remains a very difficult
task, which may be illustrated by a few figures. Recent simulations of equilibrium
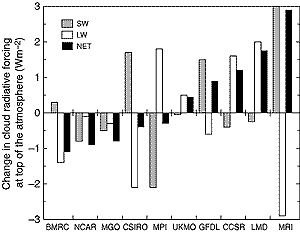
climate with a doubling of CO2 indicate that the induced variation
of net cloud radiative forcing short-wave or long-wave, ranges within ±3
Wm-2, which is a small fraction of the cloud mean long-wave warming
(30 to 35 Wm-2) or cloud mean short-wave cooling (45 to 50 Wm-2)
(Le Treut and McAvaney, 2000; Figure 7.2). Although most
models simulate CRF values within the uncertainty range of the observed values,
the discrepancy in terms of response to CO2 increase is large, both
in sign, amplitude, and share between long-wave and short-wave. This disagreement
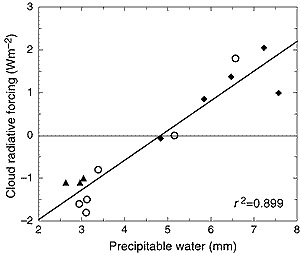
(amplified by the water vapour feedback) reflects the sensitivity of the simulated
feedbacks to model formulation (Watterson et al., 1999; Yao and Del Genio, 1999;
Meleshko et al., 2000) and is the cause of the large spread in model climate
sensitivity (see Figure 7.3; and Chapters
8 and 9). The correct simulation of the mean distribution
of cloud cover and radiative fluxes is therefore a necessary but by no means
sufficient test of a modelís ability to handle realistically the cloud
feedback processes relevant for climate change.

Figure 7.2: Change in the Top of the Atmosphere (TOA) Cloud
Radiative Forcing (CRF) associated with a CO2 doubling
(from a review by Le Treut and McAvaney, 2000). The models are coupled
to a slab ocean mixed layer and are brought to equilibrium for present
climatic conditions and for a double CO2 climate. The sign
is positive when an increase of the CRF (from present to double CO2
conditions) increases the warming, negative when it reduces it. The
contribution of the shortwave (SW, solar) and long-wave (LW, terrestrial)
components are first distinguished, and then added to provide a net
effect (black bars). Results presented in the diagram are bounded
by a 3 Wm-2 limit. As in Chapter 8,
Table 8.1, the acronyms refer to the atmospheric
models of the following institutions: BMRC is the Bureau of Meteorology
Research Center (Australia); NCAR is the National Center for Atmospheric
Research (USA); CSIRO is the Commonwealth Scientific and Industrial
Research Organization (Australia); MPI the Max Planck Institute for
Meteorology (Germany); UKMO refers to the model of the Hadley Centre
(UK); GFDL is the Geophysical Fluid Dynamics Laboratory (USA); CCSR
is the Center for Climate System Research (Japan); LMD is the Laboratoire
de Météorologie Dynamique (the corresponding coupled
model being referenced as IPSL, France); MRI is the Meteorological
Research Institute (Japan). The MGO model appears only in this intercomparison
and is the model of the Main Geophysical Observatory (Russia) (see
reference in Meleshko et al., 2000). |
|

Figure 7.3: Relationship between simulated global annually averaged
variation of net cloud radiative forcing at the top of the atmosphere
and precipitable water due to CO2 doubling produced in simulations
with different parametrizations of cloud related processes. Results
are from Colman and McAvaney (1995) denoted by triangles, Meleshko
et al. (2000) denoted by open circles, and Yao and Del Genio (1999)
denoted by diamonds. |
|
Satellite records provide some access to the study of natural climate fluctuations,
such as the seasonal or ENSO cycles, which can be used to test the ability of
the models to represent different feedbacks. At these time-scales, however,
cloud structures are characterised by large shifts in their latitudinal or longitudinal
position, as well as changes in their vertical distribution in response to SST
changes. Only those latter effects are really relevant to test climate models
in the context of climate change. Bony et al. (1997) have shown that in the
inter-tropical regions, it was possible to isolate them by looking at the dependence
of cloud properties on SST for specified dynamical regimes. These regressions
are remarkably consistent when carried out with different sets of independent
data (ISCCP, ERBE, TOVS, SSMI) and offer a constraining test for models. Similar
methodologies are being developed for the mid-latitudes (Tselioudis et al.,
2000). It is encouraging, though, that CCM3 has demonstrated considerable accuracy
in the reproduction of regional all-sky long-wave and short-wave radiation budgets
(Kiehl et al., 1998).
Since the SAR, there has been progress in the qualitative understanding of
the complexity of cloud/climate relation. There is also an important and ongoing
evolution of the cloud parametrizations included into the models, which is characterised
by a greater physical consistency and a greatly enhanced physical content: in
particular many models now include a more comprehensive representation of sub-grid
scales, convective or turbulent, and explicit microphysics, liquid or ice. Simulation
of current climate with those advanced models demonstrate capability to reproduce
realistically many features of the cloud radiative forcing and its seasonal
variations, for both the solar and terrestrial components.
In spite of these improvements, there has been no apparent narrowing of the
uncertainty range associated with cloud feedbacks in current climate change
simulations. A straight-forward approach of model validation is not sufficient
to constrain the models efficiently and a more dedicated approach is needed.
This should be favoured by a greater availability of satellite measurements.
|