 |
 |
 |
|
IPCC Fourth Assessment Report: Climate Change 2007 |
|
 |
|
 |
|
|
Climate Change 2007: Working Group I: The Physical Science Basis Errata
Last updated: 15 June 2012
Note. The following is a list of errata and corrections to the Working Group I contribution to the IPCC Fourth Assessment Report
| Page | Item | Correction |
|---|
33 | Technical Summary Table TS.2 | A number of species were inadvertently omitted that should have been included in the original table {Table 2.14}. Minor typographical errors (unit, superscripts, and footnotes) have also been corrected. Please see end of this Errata for the complete table {Table 2.14 Errata} | 38 | Technical Summary Figure TS.7,
Panel A | The bottom left label of the y-axis should be -1.0 and not -0.1 as given. | 135 | Chapter 2 FAQ 2.1, Figure 1 | The red label on the graph should read: “Carbon Dioxide”. Please see end of this Errata for the revised figure {FAQ 2.1, Figure 1 Errata} | 135 | Chapter 2 FAQ 2.1, Figure 1 | The CH4 curve was incorrectly plotted. Please see end of this Errata for the revised figure {FAQ 2.1, Figure 1 Errata} | 174 | Chapter 2
Table 2.7
| The Radiative Forcing value for Suzuki et al. (2004) should be
-0.54 and not 0.54 as given | 176 | Chapter 2
Table 2.7
| Footnote d should refer to
Figure 2.14 and not Figure 2.16 as given. | 197 | Chapter 2 Figure 2.19 | The “j” and “o” labels in the “Black Carbon:Direct” row should be reversed. | 208 | Chapter 2
Figure 2.23 | The caption should read: “...instantaneous all-sky RF (bottom panel) and surface forcing (top panel)...” | 212 | Chapter 2
Table 2.14 | A number of species were inadvertently omitted that should have been included in the original table. Minor typographical errors (unit, superscripts, and footnotes) have also been corrected. Please see end of this Errata for the complete table. {Table 2.14 Errata} | 223 | Chapter 2 2.References | The following references should be added: IPCC, 1996: Climate Change 1995: The Science of Climate Change [Houghton, J. T., et al. (eds.)]. Cambridge University Press, Cambridge, United Kingdom and New York, NY, USA, 572 pp. | 268 | Chapter 3 Figure 3.17,
Panel A | The bottom left label of the y-axis should be -1.0 and not -0.1 as given. | 319 | Chapter 3 3.References | Reference: “Allan, R.P., et al., 2001 …” should be: “Allan, R., et al., 2001: Is there an Indian Ocean dipole, and is it independent of the El Niño - Southern Oscillation? CLIVAR Exchanges, 6, 18-22.” | 425 | Chapter 5 5.References | Reference: “Minami, H., Y. Kano, and K. Ogawa, 1998 …” should be: “Minami, H., Y. Kano and K. Ogawa, 1999: Long-term variations of potential temperature and dissolved oxygen of the Japan Sea proper water. J. Oceanogr., 55, 197-205.” | 513 | Chapter 7 FAQ 7.1, Figure 1 | In Panel (a) the “Land-Based Sink” and “Net Oceanic Sink” labels should be reversed. | 513 | Chapter 7 FAQ 7.1, Figure 1 | In Panel (d) the “Human-caused Sources” bar should indicate a value of 6.7 and an uncertainty range of 3.0-11.7.
| 523 | Chapter 7 Figure 7.8 | The caption should read: “...who used wind speeds taken at the 0.995 sigma level (about 40 m above the sea surface.” | 546 | Chapter 7 Table 7.7 | Natural Sources of NH3 in Oceans range for AR4 should read: (3-16) and not (3-6) as given. | 550 | Chapter 7 Section 7.4.4.2.1 | In paragraph 1, line 7, reference to Stevenson et al (2006) should be to: Stevenson et al (2005) | 550 | Chapter 7 Section 7.4.4.2.3 | In paragraph 1, line 6, reference to Stevenson et al (2005) should be to: Stevenson et al (2006) | 580 | Chapter 7 7.References | The following reference should be added: “Oeschger, H., U. Siegenthaler, and M. Heimann, 1980: The carbon cycle and its perturbation by man. In: Interactions of Energy and Climate [W. Bach, J. Pankrath, and J. Williams (eds.)]. Reidel, Dordrecht, pp. 107-127.” | 600
| Chapter 8
FAQ 8.1, Figure 1
| The caption should read:
“Global mean near-surface temperature anomalies...” | 635 | Chapter 8 Section 8.6.3.1.2 | The heading for section 8.6.3.1.2 should be: “Summary of water vapour and lapse rate feedbacks” | 673
| Chapter 9
Section
9.2.1.3
|
In paragraph 5, line 4, reference to Goosse et al., 2005 should be to:
Goosse et al., 2005a
|
681
| Chapter 9
Section
9.3.3.1
|
In paragraph 3, line 15, reference to Goosse et al., 2005 should be to:
Goosse et al., 2005b
| 721
| Chapter 9
Table 9.3
| The caption should read:
“...while the other studies use uniform prior distributions of ECS, except for Gregory et al. (2002a) who implicitly use a uniform prior on transient climate response (see Frame et al., 2005), and Annan et al. (2005) who select a range based on sampling uncertain parameters in their model.”
|
735
| Chapter 9
9. References
|
The following reference should be added:
Goosse, H., H. Renssen, A. Timmermann, and R.S. Bradley, 2005a: Internal and forced climate variability during the last millennium: a model-data comparison using ensemble simulations. Quat. Sci. Rev., 24, 1345-1360.
|
735
| Chapter 9
9. References
|
Reference: “Goosse, H. et al., 2005...” should be:
Goosse, H. et al., 2005b: Modelling the climate of the last millennium: What causes the differences between simulations? Geophys. Res. Lett., 32(6), L06710, doi:10.1029/2005GL022368
|
854
| Chapter 11
Table 11.1
|
In column ‘Region’, coordinates for WAF should read:
12S,20W to 18N,22E
|
854
| Chapter 11
Table 11.1
|
In column ‘Region’, coordinates for SAH should read:
18N,20W to 30N,65E
|
855
| Chapter 11
Table 11.1
|
In column ‘Region’, coordinates for TIB should read:
30N,75E to 50N,100E
|
855
| Chapter 11
Table 11.1
|
In column ‘Region’, coordinates for SAS should read:
5N,65E to 30N,100E
|
855
| Chapter 11
Table 11.1
|
In column ‘Region’, coordinates for SEA should read:
11S,95E to 20N,155E
|
856
| Chapter 11
Table 11.1
|
In column ‘Region’, coordinates for WNA should read:
30N,130W to 60N,103W
|
919 | Chapter 11 Section 11.10.1.2 | In paragraph 3, line 11, reference to Rowell, 2005 should be to: Rowell, 2006 | 925 | Chapter 11 Section 11.10.2.2.5 | In paragraph 2, line 3, reference to Rowell (2005) should be to: Rowell (2006) | 936 | Chapter 11 11.References | The following reference should be added: “Rowell, D. P., 2006: A demonstration of the uncertainty in projections of UK climate change resulting from regional model formulation. Climatic Change, 79, 243-257 | 944 | Glossary Dobson unit (DU) | The definition of Dobson unit should read: “...2.69 × 1020 molecules per square metre” |
SM. 9-11 | Chapter 9
Supplementary Material
Table S9.1 | In column ‘A+N’, beginning of row 3 should read:
3: CCSM3, USA 8 N y y |
SM. 9-11 | Chapter 9
Supplementary Material
Table S9.1
| In column ‘A+N’, beginning of row 11 and row 12 should read:
11: GFDL-CM2.0, USA 3 N y y
12: GFDL-CM2.1, USA 5 N y y |
Table 2.14 (Errata). Lifetimes, radiative efficiencies and direct (except for CH4) GWPs relative to CO2. For ozone-depleting substances and their replacements, data are taken from IPCC/TEAP (2005) unless otherwise stated. See IPCC AR4 (Forster et al., 2007; Section 2.10.2 and Table 2.14) for details. A number of species were inadvertently omitted that should have been included in the list, and the complete table appears below. Information on the GWPs of these species were included in IPCC TAR (Ramaswamy et al., 2001;Tables 6.7 and 6.8). These species are now included in this Errata to Table 2.14 of IPCC AR4 (Forster et al., 2007), following established procedures and precedents. CO2 AGWP values from IPCC AR4 (Forster et al., 2007; Section 2.10.2), and estimates of the lifetimes and radiative efficiency of these species (based on TAR and updates from WMO (2002, Chapter 1)), are employed to obtain their GWPs. Estimates of GWPs from SAR‡ are also listed for reference. Minor typographical errors (unit, parenthesis, superscripts, and footnotes) have also been corrected in this Errata. | | | | | Global Warming Potential For Given Time Horizon |
|---|
| Industrial Designation or Common Name | Chemical Formula | Lifetime (years) | Radiative Efficiency (W m–2 ppb–1) | SAR‡ (100-yr) | 20-yr | 100-yr | 500-yr |
|---|
| Carbon dioxide | CO2 | See belowa | b1.4x10–5 | 1 | 1 | 1 | 1 | | Methanec | CH4 | 12c | 3.7x10⁻⁴ | 21 | 72 | 25 | 7.6 | | Nitrous oxide | N2O | 114 | 3.03x10⁻³ | 310 | 289 | 298 | 153 | | Substances controlled by the Montreal Protocol | | CFC-11 | CCl3F | 45 | 0.25 | 3,800 | 6,730 | 4,750 | 1,620 | | CFC-12 | CCl2F2 | 100 | 0.32 | 8,100 | 11,000 | 10,900 | 5,200 | | CFC-13 | CClF3 | 640 | 0.25 | | 10,800 | 14,400 | 16,400 | | CFC-113 | CCl2FCClF2 | 85 | 0.3 | 4,800 | 6,540 | 6,130 | 2,700 | | CFC-114 | CClF2CClF2 | 300 | 0.31 | | 8,040 | 10,000 | 8,730 | | CFC-115 | CClF2CF3 | 1,700 | 0.18 | | 5,310 | 7,370 | 9,990 | | Halon-1301 | CBrF3 | 65 | 0.32 | 5,400 | 8,480 | 7,140 | 2,760 | | Halon-1211 | CBrClF2 | 16 | 0.3 | | 4,750 | 1,890 | 575 | | Halon-2402 | CBrF2CBrF2 | 20 | 0.33 | | 3,680 | 1,640 | 503 | | Carbon tetrachloride | CCl4 | 26 | 0.13 | 1,400 | 2,700 | 1,400 | 435 | | Methyl bromide | CH3Br | 0.7 | 0.01 | | 17 | 5 | 1 | | Methyl chloroform | CH3CCl3 | 5 | 0.06 | 100* | 506 | 146 | 45 | | HCFC-21 | CHCl2F | 1.7 | 0.14 | | 530 | 151 | 46 | | HCFC-22 | CHClF2 | 12 | 0.2 | 1,500 | 5,160 | 1,810 | 549 | | HCFC-123 | CHCl2CF3 | 1.3 | 0.14 | 90 | 273 | 77 | 24 | | HCFC-124 | CHClFCF3 | 5.8 | 0.22 | 470 | 2,070 | 609 | 185 | | HCFC-141b | CH3CCl2F | 9.3 | 0.14 | 600 | 2,250 | 725 | 220 | | HCFC-142b | CH3CClF2 | 17.9 | 0.2 | 1,800 | 5,490 | 2,310 | 705 | | HCFC-225ca | CHCl2CF2CF3 | 1.9 | 0.2 | | 429 | 122 | 37 | | HCFC-225cb | CHClFCF2CClF2 | 5.8 | 0.32 | | 2,030 | 595 | 181 | | Hydrofluorocarbons | | HFC-23 | CHF3 | 270 | 0.19 | 11,700 | 12,000 | 14,800 | 12,200 | | HFC-32 | CH2F2 | 4.9 | 0.11 | 650 | 2,330 | 675 | 205 | | HFC-41 | CH3F | 2.4 | 0.02 | 150 | 323 | 92 | 28 | | HFC-125 | CHF2CF3 | 29 | 0.23 | 2,800 | 6,350 | 3,500 | 1,100 | | HFC-134 | CHF2CHF2 | 9.6 | 0.18 | 1000 | 3,400 | 1,100 | 335 | | HFC-134a | CH2FCF3 | 14 | 0.16 | 1,300 | 3,830 | 1,430 | 435 | | HFC-143 | CH2FCHF2 | 3.5 | 0.13 | 300 | 1,240 | 353 | 107 | | HFC-143a | CH3CF3 | 52 | 0.13 | 3,800 | 5,890 | 4,470 | 1,590 | | HFC-152 | CH2FCH2F | 0.60 | 0.09 | | 187 | 53 | 16 | | HFC-152a | CH3CHF2 | 1.4 | 0.09 | 140 | 437 | 124 | 38 | | HFC-161 | CH3CH2F | 0.3 | 0.03 | | 43 | 12 | 3.7 | | HFC-227ea | CF3CHFCF3 | 34.2 | 0.26 | 2,900 | 5,310 | 3,220 | 1,040 | | HFC-236cb | CH2FCF2CF3 | 13.6 | 0.23 | | 3,630 | 1,340 | 407 | | HFC-236ea | CHF2CHFCF3 | 10.7 | 0.3 | | 4,090 | 1,370 | 418 | | HFC-236fa | CF3CH2CF3 | 240 | 0.28 | 6,300 | 8,100 | 9,810 | 7,660 | | HFC-245ca | CH2FCF2CHF2 | 6.2 | 0.23 | 560 | 2,340 | 693 | 211 | | HFC-245fa | CHF2CH2CF3 | 7.6 | 0.28 | | 3,380 | 1,030 | 314 | | HFC-365mfc | CH3CF2CH2CF3 | 8.6 | 0.21 | | 2,520 | 794 | 241 | | HFC-43-10mee | CF3CHFCHFCF2CF3 | 15.9 | 0.4 | 1,300 | 4,140 | 1,640 | 500 |
| | | | | Global Warming Potential For Given Time Horizon |
|---|
| Industrial Designation or Common Name | Chemical Formula | Lifetime (years) | Radiative Efficiency (W m–2 ppb–1) | SAR‡ (100-yr) | 20-yr | 100-yr | 500-yr |
|---|
| Perfluorinated compounds | | Sulphur hexafluoride | SF6 | 3,200 | 0.52 | 23,900 | 16,300 | 22,800 | 32,600 | | Nitrogen trifluoride | NF3 | 740 | d0.21 | | 12,300 | 17,200 | 20,700 | | PFC-14 | CF4 | 50,000 | e0.10 | 6,500 | 5,210 | 7,390 | 11,200 | | PFC-116 | C2F6 | 10,000 | 0.26 | 9,200 | 8,630 | 12,200 | 18,200 | | PFC-218 | C3F8 | 2,600 | 0.26 | 7,000 | 6,310 | 8,830 | 12,500 | | PFC-318 | c-C4F8 | 3,200 | 0.32 | 8,700 | 7,310 | 10,300 | 14,700 | | PFC-3-1-10 | C4F10 | 2,600 | 0.33 | 7,000 | 6,330 | 8,860 | 12,500 | | PFC-4-1-12 | C5F12 | 4,100 | 0.41 | 7,500 | 6,510 | 9,160 | 13,300 | | PFC-5-1-14 | C6F14 | 3,200 | 0.49 | 7,400 | 6,600 | 9,300 | 13,300 | | PFC-9-1-18 | C10F18 | >1,000f | 0.56 | | >5,500 | >7,500 | >9,500 | | trifluoromethyl sulphur pentafluoride | SF5CF3 | 800 | 0.57 | | 13,200 | 17,700 | 21,200 | | Perfluorocyclopropane | c-C3F6 | >1000 | 0.42 | | >12,700 | >17,340 | >21,800 | | Fluorinated ethers | | HFE-125 | CHF2OCF3 | 136 | 0.44 | | 13,800 | 14,900 | 8,490 | | HFE-134 | CHF2OCHF2 | 26 | 0.45 | | 12,200 | 6,320 | 1,960 | | HFE-143a | CH3OCF3 | 4.3 | 0.27 | | 2,630 | 756 | 230 | | HCFE-235da2 | CHF2OCHClCF3 | 2.6 | 0.38 | | 1,230 | 350 | 106 | | HFE-245cb2 | CH3OCF2CF3 | 5.1 | 0.32 | | 2,440 | 708 | 215 | | HFE-245fa2 | CHF2OCH2CF3 | 4.9 | 0.31 | | 2,280 | 659 | 200 | | HFE-254cb2 | CH3OCF2CHF2 | 2.6 | 0.28 | | 1,260 | 359 | 109 | | HFE-347mcc3 | CH3OCF2CF2CF3 | 5.2 | 0.34 | | 1,980 | 575 | 175 | | HFE-347pcf2 | CHF2CF2OCH2CF3 | 7.1 | 0.25 | | 1,900 | 580 | 175 | | HFE-356pcc3 | CH3OCF2CF2CHF2 | 0.33 | 0.93 | | 386 | 110 | 33 | | HFE-449sl (HFE-7100) | C4F9OCH3 | 3.8 | 0.31 | | 1,040 | 297 | 90 | | HFE-569sf2 (HFE-7200) | C4F9OC2H5 | 0.77 | 0.3 | | 207 | 59 | 18 | | HFE-43-10pccc124 (H-Galden 1040x) | CHF2OCF2OC2F4OCHF2 | 6.3 | 1.37 | | 6,320 | 1,870 | 569 | | HFE-236ca12 (HG-10) | CHF2OCF2OCHF2 | 12.1 | 0.66 | | 8,000 | 2,800 | 860 | | HFE-338pcc13 (HG-01) | CHF2OCF2CF2OCHF2 | 6.2 | 0.87 | | 5,100 | 1,500 | 460 | | | (CF3)2CFOCH3 | 3.4 | 0.31 | | 1204 | 343 | 104 | | | CF3CF2CH2OH | 0.4 | 0.24 | | 147 | 42 | 13 | | | (CF3)2CHOH | 1.8 | 0.28 | | 687 | 195 | 59 | | HFE-227ea | CF3CHFOCF3 | 11 | 0.40 | | 4,540 | 1,540 | 468 | | HFE-236ea2 | CHF2OCHFCF3 | 5.8 | 0.44 | | 3,370 | 989 | 301 | | HFE-236fa | CF3CH2OCF3 | 3.7 | 0.34 | | 1,710 | 487 | 148 | | HFE-245fa1 | CHF2CH2OCF3 | 2.2 | 0.30 | | 1,010 | 286 | 87 | | HFE 263fb2 | CF3CH2OCH3 | 0.2 | 0.1 | | 38 | 11 | 3 | | HFE-329mcc2 | CHF2CF2OCF2CF3 | 6.8 | 0.49 | | 3,060 | 919 | 279 | | HFE-338mcf2 | CF3CH2OCF2CF3 | 4.3 | 0.43 | | 1,920 | 552 | 168 | | HFE-347mcf2 | CHF2CH2OCF2CF3 | 2.8 | 0.41 | | 1,310 | 374 | 114 | | HFE-356mec3 | CH3OCF2CHFCF3 | 0.94 | 0.30 | | 355 | 101 | 31 | | HFE-356pcf2 | CHF2CH2OCF2CHF2 | 2.0 | 0.37 | | 931 | 265 | 80 | | HFE-356pcf3 | CHF2OCH2CF2CHF2 | 3.6 | 0.39 | | 1,760 | 502 | 153 | | HFE 365mcf3 | CF3CF2CH2OCH3 | 0.27 | 0.11 | | 41 | 11 | 4 |
| | | | | Global Warming Potential For Given Time Horizon |
|---|
| Industrial Designation or Common Name | Chemical Formula | Lifetime (years) | Radiative Efficiency (W m–2 ppb–1) | SAR‡ (100-yr) | 20-yr | 100-yr | 500-yr |
|---|
| Fluorinated ethers (continued) | | HFE-374pc2 | CHF2CF2OCH2CH3 | 5.0 | 0.25 | | 1,930 | 557 | 169 | | | - (CF2)4CH (OH) - | 0.3 | 0.85 | | 258 | 73 | 23 | | | (CF3)2CHOCHF2 | 3.1 | 0.41 | | 1,330 | 380 | 115 | | | (CF3)2CHOCH3 | 0.25 | 0.30 | | 94 | 27 | 8.2 | | Perfluoropolyethers | | PFPMIE | CF3OCF(CF3)CF2OCF2OCF3 | 800 | 0.65 | | 7,620 | 10,300 | 12,400 | | Hydrocarbons and other compounds – Direct Effects | | Dimethylether | CH3OCH3 | 0.015 | 0.02 | | 1 | 1 | <<1 | | Chloroform | CHCl3 | 0.51 | 0.11 | 4 | 108 | 31 | 9.3 | | Methylene chloride | CH2Cl2 | 0.38 | 0.03 | 9 | 31 | 8.7 | 2.7 | | Methyl chloride | CH3Cl | 1.0 | 0.01 | | 45 | 13 | 4 | | | CH2Br2 | 0.41 | 0.01 | | 5.4 | 1.54 | 0.47 | | Halon-1201 | CHBrF2 | 5.8 | 0.14 | | 1,380 | 404 | 123 | | Trifluoroiodomethane | CF3I | 0.005 | 0.23 | <1 | 1 | 0.4 | 0.1 |
___________________________________________________________________________________________________________
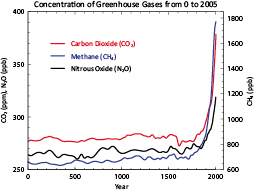
FAQ 2.1, Figure 1 (Errata). Revised figure showing atmospheric concentrations of important long-lived greenhouse gases over the last 2,000 years. Using the combined and simplified data from Chapters 6 and 2, the original figure displayed the CH4 curve incorrectly. The revised figure shows the same data correctly plotted. For further details please refer to the original figure caption.
|
|