TS.4.3 Magnitudes of impact for varying amounts of climate change
Magnitudes of impact can now be estimated more systematically for a range of possible increases in global average temperature.
Since the IPCC Third Assessment, many additional studies, particularly in regions that previously had been little researched, have enabled a more systematic understanding of how the timing and magnitude of impacts is likely to be affected by changes in climate and sea level associated with differing amounts and rates of change in global average temperature.
Examples of this new information are presented in Tables TS.3 and TS.4. Entries have been selected which are judged to be relevant for people and the environment and for which there is at least medium confidence in the assessment. All entries of impact are drawn from chapters of the Assessment, where more detailed information is available. Depending on circumstances, some of these impacts could be associated with ‘key vulnerabilities’, based on a number of criteria in the literature (magnitude, timing, persistence/reversibility, the potential for adaptation, distributional aspects, likelihood and ‘importance’ of the impacts). Assessment of potential key vulnerabilities is intended to provide information on rates and levels of climate change to help decision-makers make appropriate responses to the risks of climate change [19.ES, 19.1].
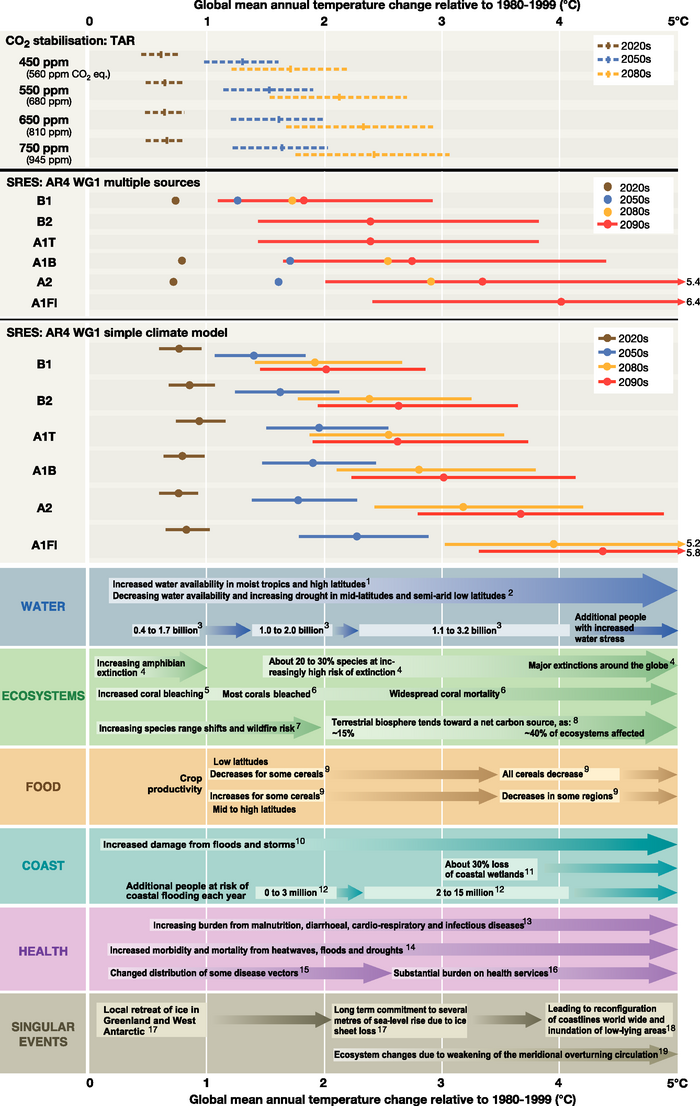
Table TS.3. Examples of global impacts projected for changes in climate (and sea level and atmospheric CO2 where relevant) associated with different amounts of increase in global average surface temperature in the 21st century [T20.8]. This is a selection of some estimates currently available. All entries are from published studies in the chapters of the Assessment. (Continues below Table TS.4.)
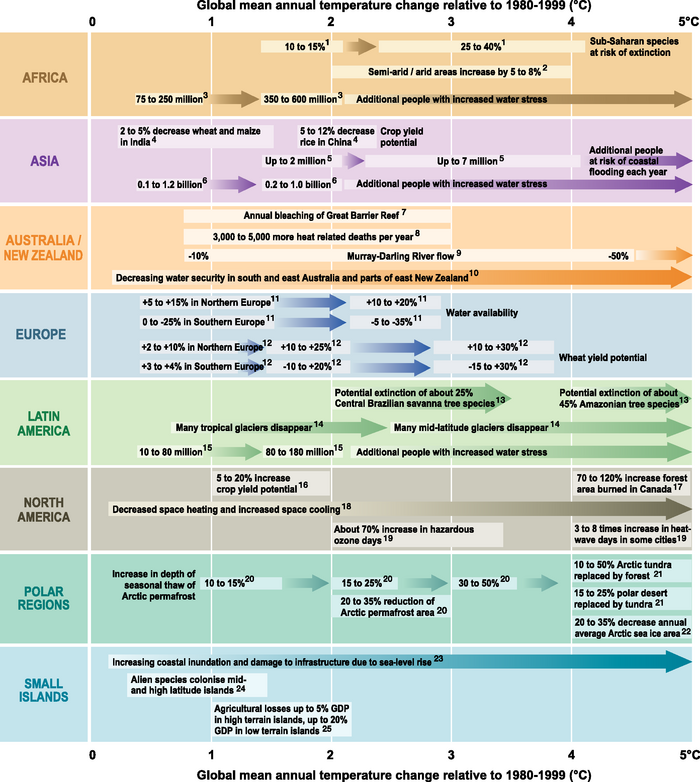
Table TS.4. Examples of regional impacts [T20.9]. See caption for Table TS.3.
Table TS.3. (cont.) Edges of boxes and placing of text indicate the range of temperature change to which the impacts relate. Arrows between boxes indicate increasing levels of impacts between estimations. Other arrows indicate trends in impacts. All entries for water stress and flooding represent the additional impacts of climate change relative to the conditions projected across the range of SRES scenarios A1FI, A2, B1 and B2. Adaptation to climate change is not included in these estimations. For extinctions, ‘major’ means ~40 to ~70% of assessed species.
The table also shows global temperature changes for selected time periods, relative to 1980-1999, projected for SRES and stabilisation scenarios. To express the temperature change relative to 1850-1899, add 0.5°C. More detail is provided in Chapter 2 [Box 2.8]. Estimates are for the 2020s, 2050s and 2080s, (the time periods used by the IPCC Data Distribution Centre and therefore in many impact studies) and for the 2090s. SRES-based projections are shown using two different approaches. Middle panel: projections from the WGI AR4 SPM based on multiple sources. Best estimates are based on AOGCMs (coloured dots). Uncertainty ranges, available only for the 2090s, are based on models, observational constraints and expert judgement. Lower panel: best estimates and uncertainty ranges based on a simple climate model (SCM), also from WGI AR4 (Chapter 10). Upper panel: best estimates and uncertainty ranges for four CO2-stabilisation scenarios using an SCM. Results are from the TAR because comparable projections for the 21st century are not available in the AR4. However, estimates of equilibrium warming are reported in the WGI AR4 for CO2-equivalent stabilisation. Note that equilibrium temperatures would not be reached until decades or centuries after greenhouse gas stabilisation.