Working Group I: The Scientific Basis


Other reports in this collection

Continued from previous page

A number of new transient AOGCM simulations for the SRES A2 and B2 scenarios have recently become available and a preliminary analysis was conducted by the lead authors. This follows the procedure similar to that described in this section in relation to Figures 10.3 to 10.6. The results are presented in Box 10.1.

Box 10.1: Regional climate change in AOGCMs which use SRES emission scenarios

Introduction
This box summarises results on regional climate change obtained from a set of nine AOGCM simulations undertaken using SRES preliminary marker emission scenarios A2 and B2. The models are CGCM2, CSIRO Mk2, CSM 1.3, ECHAM4/OPYC, GFDL_R30_c, HadCM3, MRI2, CCSR/NIES2, DOE PCM, (numbered 7, 10, 12, 15, 18, 23, 27, 31 and 30 in Chapter 9, Table 9.1). The results are based on data for 2071 to 2100 and 1961 to 1990 that have been directly analysed and assessed by the lead authors. These results should be treated as preliminary only.

Analysis
Regional changes in precipitation and temperature were calculated using the same methodology as that of Giorgi and Francisco (2000b) (see Figures 10.1, 10.3 and 10.5). The results were then assessed for inter-model consistency using the same method as that used in Figures 10.4 and 10.6 for the earlier set of simulations. The results for temperature are in Box10.1, Figure1 and for precipitation in Box10.2, Figure2.

The SRES results may be compared with the earlier results summarised in Figures 10.4 and 10.6 (which will be referred to here as the IS92a results). However, it should be noted that these two sets of results differ in the set of models used (both in the model versions and in the total number of simulations), and in the scenarios contrasted in each case (for IS92a it is GHG-only versus GHG+sulphate and for SRES it is A2 versus B2). Also, due to differences in the number of models, thresholds for agreement are not the same in each case (although they have been chosen to be as nearly equivalent as possible).

Box 10.1, Figure 1: Analysis of inter-model consistency in regional relative warming (warming relative to each model�s global warming). Regions are classified as showing either agreement on warming in excess of 40% above the global average (‘Much greater than average warming�), agreement on warming greater than the global average (‘Greater than average warming�), agreement on warming less than the global average (‘Less than average warming�), or disagreement amongst models on the magnitude of regional relative warming (‘Inconsistent magnitude of warming�). There is also a category for agreement on cooling (which never occurs). A consistent result from at least seven of the nine models is deemed necessary for agreement. The global annual average warming (DJF and JJA combined) of the models used span 1.2 to 4.5°C for A2 and 0.9 to 3.4°C for B2, and therefore a regional 40% amplification represents warming ranges of 1.7 to 6.3°C for A2 and 1.3 to 4.7°C for B2.

Results
SRES

  • Under both SRES cases, most land areas warm more rapidly than the global average. The warming is in excess of 40% above the global average in all high northern latitude regions and Tibet (ALA, GRL, NEU, NAS and TIB) in DJF, and in the Mediterranean basin, central and northern Asia and Tibet (MED, CAS, NAS, and TIB) in JJA. Only in South Asia and southern South America (SAS and SSA) in JJA and southeast Asia (SEA) in both seasons do the models consistently show warming less than the global average.
  • For precipitation, consistent increase is evident in both SRES scenarios over high latitude regions (ALA, GRL, NAS and ANT) in both seasons, northern mid-latitude regions and tropical Africa (WNA, ENA, NEU, CAS, TIB, WAF and EAF) in DJF, and South Asia, East Asia and Tibet (SAS, EAS and TIB) in JJA. Consistent precipitation decrease is present over Central America (CAM) in DJF and over Australia and southern Africa (NAU, SAU and SAF) in JJA.
  • Differences between the A2 and B2 results are minor and are mainly evident for precipitation. In the B2 scenario there are fewer regions showing consistently large precipitation changes, and there is a slight increase in the frequency of regions showing �inconsistent� and �no change� results. As the climate forcing is smaller in the B2 case and the climate response correspondingly weaker, some differences of this nature are to be expected.

SRES versus IS92a

  • In broad terms, the temperature results from SRES are similar to the IS92a results. In each of the two SRES and IS92a cases, warming is in excess of 40% above the global average in Alaska, northern Canada, Greenland, northern Asia, and Tibet (ALA, GRL, NAS and TIB) in DJF and in central Asia and Tibet (CAS and TIB) in JJA. All four cases also show warming less than the global average in South and Southeast Asia, and southern South America (SAS, SEA and SSA) in JJA.
  • The main difference in the results is that there are substantially more instances for the SRES cases where there is disagreement on the magnitude of the relative regional warming. This difference is mainly evident in tropical and Southern Hemisphere regions.
  • The precipitation results from SRES are also broadly similar to the corresponding IS92a results. There are many regions where the direction of precipitation change (although not necessarily the magnitude of this change) is consistent across all four cases. In DJF this is true for increase in northern mid- to high latitude regions, Antarctica and tropical Africa (ALA, GRL, WNA, ENA, NEU, NAS, TIB, CAS, WAF, EAF and ANT) and decrease in Central America (CAM). In JJA it is true for increase in high latitude regions (ALA, GRL, NAS and ANT) and for decrease in southern and northern Australia (SAU and NAU). Little change in Southeast Asia in DJF and little change or increase over South Asia in JJA are also consistent results.
  • Although there are no cases where the SRES and IS92a results indicate precipitation changes of opposite direction, there are some notable differences. In the Sahara and in East Asia (SAH and EAS) in JJA, the results for both SRES scenarios show consistent increase whereas this was not true in either of the IS92a cases. On the other hand, in central North America and northern Australia (CNA and NAU) in DJF, and in East Africa (EAF) in JJA, the results for both SRES scenarios show model disagreement whereas the IS92a scenarios showed a consistent direction of change (increase in CNA, and decrease in EAF and NAU). It is also notable that the consistent decrease in JJA precipitation over the Mediterranean basin (MED) seen for both IS92a cases is present for SRES only for the A2 scenario (for which the decrease is large).

Box 10.1, Figure 2: Analysis of inter-model consistency in regional precipitation change. Regions are classified as showing either agreement on increase with an average change of greater than 20% (‘Large increase�), agreement on increase with an average change between 5 and 20% (‘Small increase�), agreement on a change between -5 and +5% or agreement with an average change between -5 and 5% (‘No change�), agreement on decrease with an average change between -5 and -20% (‘Small decrease�), agreement on decrease with an average change of less than -20% (‘Large decrease�), or disagreement (‘Inconsistent sign�). A consistent result from at least seven of the nine models is deemed necessary for agreement.

Uncertainty
The above comparisons concern the quantification of two different sources of uncertainty represented in the cascade of uncertainty described in Chapter 13, Section 13.5.1 (Figure 13.2). These include uncertainties in future emissions (IS92a GG and GS; SRES A2 and B2), and uncertainties in modelling the response of the climate system to a given forcing (samples of up to nine AOGCMs). Agreement across the different scenarios and climate models suggests, relatively speaking, less uncertainty about the nature of regional climate change than where there is disagreement. For example, the agreement for northern latitude winter precipitation extends across all emission scenarios and all models, whereas there is considerable disagreement (greater uncertainty) for tropical areas in JJA. Note that these measures of uncertainty are qualitative and applied on a relatively coarse spatial scale. It should also be noted that the range of uncertainty covered by the four emissions scenarios does not encompass the entire envelope of uncertainty of emissions (see Chapter 9, Section 9.2.2.4, and Chapter 13, Section 13.5.1). The range of models (representing the uncertainties in modelling the response to a given forcing) is somewhat more complete than in earlier analyses, but also limited.

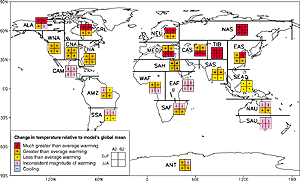
The analysis described above is for broad area-averages only and the results described should not be assumed to apply to all areas within these regions. More focused regional studies have examined within-region spatial patterns of change (Joubert and Tyson, 1996; Machenhauer et al., 1996, 1998; Pittock et al., 1995; Whetton et al., 1996b; Carril et al., 1997; Labraga and Lopez, 1997). Such studies can reveal important features which are consistent amongst models but are not apparent in area-average regional results. For example, Labraga and Lopez (1997) noted a tendency for simulated rainfall to decrease in northern Amazonia and to increase in southern parts of this region. Jones R.N. et al. (2000) noted a predominance of rainfall increase in the central equatorial Pacific (northern Polynesia), but in the areas to the west and south-west the direction of rainfall change was not clearly indicated.


Figure 10.7: For the European region, simulated change in annual precipitation, averaged by latitude and normalised to % change per °C of global warming. Results are given for twenty-three enhanced GHG simulations (forced by CO2 change only) produced between the years 1983 and 1998. The earlier experiments are those used in the SCENGEN climate scenario generator (Hulme et al., 1995) and include some mixed-layer 1x and 2xCO2 equilibrium experiments; the later ones are the AOGCM experiments available through the DDC. From Hulme et al. (2000).

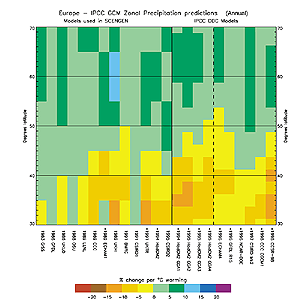
To illustrate further inter-model variations in simulated regional precipitation change, results obtained in model inter-comparison studies for the Australian, Indian, North American and European regions are examined. All of these regions have been extensively studied over the years using equilibrium 2xCO2 experiments (such as those featured in IPCC, 1990), first generation transient coupled AOGCMs (as in the SAR), and more recent AOGCMs available in the DDC (Table 9.1). This comparison also enables an assessment of how the regional precipitation projections have changed as the models evolved.

In the Australian region, the pattern of simulated precipitation change in winter (JJA) has remained broadly similar across these three groups of experiments and consists of rainfall decrease in sub-tropical latitudes and rainfall increase south of 35 to 40°S (Whetton et al., 1996a, 2001). However, as the latitude of the boundary between these two zones varied between models, southernmost parts of Australia lay in the zone where the direction of precipitation change was inconsistent amongst models. In summer (DJF) the equilibrium 2xCO2 experiments showed a strong tendency for precipitation to increase, particularly in the north-west of the continent. This tendency was replaced in the first coupled AOGCMs by one of little change or precipitation decrease, which has remained when the most recent coupled models are considered. Whetton et al. (1996a) partly attributed the contrast in the regional precipitation response of the two types of experiments to contrasts in their hemispheric patterns of warming.

Lal et al. (1998b) surveyed the results for the Indian subcontinent of seventeen climate change experiments including both equilibrium 2xCO2 and transient AOGCM simulations with and without sulphate aerosol forcing. In the simulations forced only by GHG increases, most models show wet season (JJA) rainfall increases over the region of less than 5% per degree of global warming. A minority of experiments show rainfall decreases. The experiments which included scenarios of increasing sulphate forcing all showed reduced rainfall increases, or stronger rainfall decreases, than their corresponding GHG-only experiments.

For the central plains of North America, IPCC (1990) noted a good deal of similarity in the response of equilibrium 2xCO2 experiments, with precipitation decreases prevailing in the summer and increases in the winter of less than 10%. In the second group of experiments (nine transient runs with AOGCMs) a wider range of responses was found (in the SAR). In winter, changes in precipitation ranged from about -12 to +20% for the time of CO2 doubling, and most of the models (six out of nine) exhibited increases. In summer, the range of change was narrower, within ±10%, but there was no clear majority response towards increases or decreases. Doherty and Mearns (1999) found that the CGCM1 and HadCM2 models simulated opposite changes in precipitation in both seasons over North America. While overall there is a tendency for more decreases to be simulated in the summer and more increases in the winter, there does not seem to be a reduction in the uncertainty for this region through the progression of climate models.

Many studies have considered GCM-simulated patterns of climate change in the European region (e.g., Barrow et al., 1996; Hulme and Brown, 1998; Osborn and Hulme, 1998; Räisänen, 1998; Benestad et al. 1999; Osborn et al., 1999). Hulme et al. (2000) provide an overview of simulated changes in the region by considering the results of twenty-three climate change simulations (forced by GHG change only) produced between the years 1983 and 1998 and including mixed-layer 1x and 2xCO2 equilibrium experiments as well as transient experiments. Figure 10.7 shows their results for simulated change in annual precipitation, averaged by latitude and normalised to percentage change per degree of global warming. It may be seen that the consensus amongst current models for drying in southern Europe and wetter conditions in northern Europe represents a continuation of a pattern established amongst the earlier simulations. The effect of model development has primarily been to intensify this pattern of response.

Variations across simulations in the regional enhanced GHG results of AOGCMs, which are particularly evident for precipitation, represent a major uncertainty in any assessment of regional climate change. Such variation may arise due to differences in forcing, systematic model-to-model differences in the regional response to a given forcing or differences due to natural decadal to inter-decadal scale variability in the models. Giorgi and Francisco (2000a,b) analysed AOGCM simulations including different models, forcing scenarios and ensembles of simulations, and found that the greatest source of uncertainty in regional climate change simulation was due to inter-model differences, with intra-ensemble and inter-scenario differences being less important (see Figures 10.3 and 10.5). However, it should be noted that Giorgi and Francisco (2000a,b) used long (thirty year) means and large (sub-continental scale) regions and that the uncertainty due to simulated natural variability would be larger when shorter averaging periods, or smaller regions, are used. The results of Hulme et al. (1999) also suggest that low-frequency natural climatic variability is important at the sub-regional scale in Europe and can mask the enhanced GHG signal.

Regional changes in the mean pattern of atmospheric circulation have been noted in various studies, although typically the changes are not marked (e.g., Huth, 1997; Schubert, 1998). Indeed, the work of Conway (1998) and Wilby et al. (1998b) suggests that the contribution of changes in synoptic circulation to regional climate change may be relatively small compared to that of sub-synoptic processes.


Other reports in this collection

IPCC Homepage