F.4 Projections of Future Changes in Precipitation
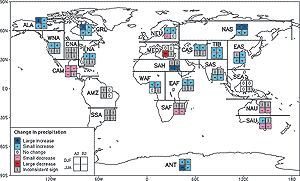
Figure 23: Analysis of inter-model consistency in regional precipitation
change. Regions are classified as showing either agreement on increase with
an average change of greater than 20% (‘Large increase’), agreement
on increase with an average change between 5 and 20% (‘Small increase’),
agreement on a change between –5 and +5% or agreement with an average
change between –5 and 5% (‘No change’), agreement on decrease
with an average change between –5 and -20% (‘Small decrease’),
agreement on decrease with an average change of less than -20% (‘Large
decrease’), or disagreement (‘Inconsistent sign’). A consistent
result from at least seven of the nine models is deemed necessary for agreement.
[Based on Chapter 10, Box
1, Figure 2] |
Globally averaged water vapour, evaporation and precipitation are projected
to increase. At the regional scale both increases and decreases in precipitation
are seen. Results (see Figure 23) from recent
AOGCM simulations forced with SRES A2 and B2
emissions scenarios indicate that it is likely for precipitation to increase in
both summer and winter over high-latitude regions. In winter, increases are also
seen over northern mid-latitudes, tropical Africa and Antarctica, and in summer
in southern and eastern Asia. Australia, central America, and southern Africa
show consistent decreases in winter rainfall.
Based on patterns emerging from a limited number of studies with current
AOGCMs, older GCMs, and regionalisation studies, there is a strong correlation
between precipitation interannual variability and mean precipitation. Future
increases in mean precipitation will likely lead to increases in variability.
Conversely, precipitation variability will likely decrease only in areas of
reduced mean precipitation.
F.5 Projections of Future Changes in Extreme Events
It is only recently that changes in extremes of weather and climate observed
to date have been compared to changes projected by models (Table
4). More hot days and heat waves are very likely over nearly all land
areas. These increases are projected to be largest mainly in areas where soil
moisture decreases occur. Increases in daily minimum temperature are projected
to occur over nearly all land areas and are generally larger where snow and ice
retreat. Frost days and cold waves are very likely to become fewer. The changes
in surface air temperature and surface absolute humidity are projected to result
in increases in the heat index (which is a measure of the combined effects of
temperature and moisture). The increases in surface air temperature are also projected
to result in an increase in the “cooling degree days” (which is a measure
of the amount of cooling required on a given day once the temperature exceeds
a given threshold) and a decrease in “heating degree days”. Precipitation
extremes are projected to increase more than the mean and the intensity of precipitation
events are projected to increase. The frequency of extreme precipitation events
is projected to increase almost everywhere. There is projected to be a general
drying of the mid-continental areas during summer. This is ascribed to a combination
of increased temperature and potential evaporation that is not balanced by increases
of precipitation. There is little agreement yet among models concerning future
changes in mid-latitude storm intensity, frequency, and variability. There is
little consistent evidence that shows changes in the projected frequency of tropical
cyclones and areas of formation. However, some measures of intensities show projected
increases, and some theoretical and modelling studies suggest that the upper limit
of these intensities could increase. Mean and peak precipitation intensities from
tropical cyclones are likely to increase appreciably.
For some other extreme phenomena, many of which may have important impacts
on the environment and society, there is currently insufficient information
to assess recent trends, and confidence in models and understanding is inadequate
to make firm projections. In particular, very small-scale phenomena such
as thunderstorms, tornadoes, hail, and lightning are not simulated in global
models. Insufficient analysis has occurred of how extra-tropical cyclones may
change.
| Table 4: Estimates of confidence in observed and
projected changes in extreme weather and climate events. The table depicts
an assessment of confidence in observed changes in extremes of weather and
climate during the latter half of the 20th century (left column) and in
projected changes during the 21st century (right column)a. This
assessment relies on observational and modelling studies, as well as physical
plausibility of future projections across all commonly used scenarios and
is based on expert judgement (see Footnote
4). [Based upon Table 9.6] |
 |
|
Confidence in observed changes (latter half of the
20th century)
|
Changes in Phenomenon
|
Confidence in projected changes (during the 21st
century)
|
| |
| Likely |
Higher maximum temperatures and more hot days over nearly all land
areas |
Very likely |
| Very likely |
Higher minimum temperatures, fewer cold days and frost days over nearly
all land areas |
Very likely |
| Very likely |
Reduced diurnal temperature range over most land areas |
Very likely |
| Likely, over many areas |
Increase of heat index8
over land areas |
Very likely, over most areas |
| Likely, over many Northern Hemisphere mid- to high latitude land areas |
More intense precipitation eventsb |
Very likely, over many areas |
| Likely, in a few areas |
Increased summer continental drying and associated risk of drought |
Likely, over most mid-latitude continental interiors (Lack of consistent
projections in other areas) |
| Not observed in the few analyses available |
Increase in tropical cyclone peak wind intensitiesc |
Likely, over some areas |
| Insufficient data for assessment |
Increase in tropical cyclone mean and peak precipitation intensitiesc |
Likely, over some areas |
|
|