Quick Links
|
Report by Chapters
- Front Matter 0.1MB
- Summary for Policymakers 11.6MB

Chapters
- 1. Climate Change: New Dimensions in Disaster Risk, Exposure, Vulnerability, and Resilience 0.8MB

- 2. Determinants of Risk: Exposure and Vulnerability 0.8MB
- 3. Changes in Climate Extremes and their Impacts on the Natural Physical Environment 19.5MB
- 4. Changes in Impacts of Climate Extremes: Human Systems and Ecosystems 6.6MB
- 5. Managing the Risks from Climate Extremes at the Local Level 1.2MB
- 6. National Systems for Managing the Risks from Climate Extremes and Disasters 1.2MB
- 7. Managing the Risks: International Level and Integration across Scales 0.6MB
- 8. Toward a Sustainable and Resilient Future 0.8MB
- 9. Case Studies 0.8MB
Annexes/Index 0.3MB
- I. Authors and Expert Reviewers
- II. Glossary of Terms
- III. Acronyms
- IV. List of Major IPCC Reports
- Index 0.3MB
On-Line Supplement
- 3.A - Notes and Technical Details on Chapter 3 Figures 0.9MB
Full Report
- Full report 31MB
SPM in UN and other languages
UN Languages
Other Languages
Drafts and Review Materials
Disclaimer:
As part of its commitment to openness and transparency, the IPCC releases drafts that have been submitted for formal expert and/or government review, review comments
on these drafts, and author responses to these comments after publication of the associated IPCC Report or Technical Paper. During the multi-stage review process,
expert reviewers and governments are invited to comment on the accuracy and completeness of the scientific/technical/socioeconomic content and the overall balance
of the drafts. Therefore, review comments and author responses should be considered within the context of the final report. Drafts, review comments, and author
responses are pre-decisional materials that are confidential until publication of the final Report or Technical Paper; they are not the results of the assessment and
may not be cited, quoted, or distributed as such. Only the approved, adopted, and accepted Reports or Technical Papers may be cited or quoted as the results of the assessment.
| Title |
First Order Draft |
Final Govt
Distribution |
| Draft |
Comments & Responses |
Draft |
Comments |
| Summary for Policymakers |
0.8MB |
1.1MB |
0.7MB |
0.8MB |
SPM Graphics
The reproduction of SREX figures and tables found on this page is authorized free of charge and without formal written permission, provided that the JPEGs are replicated exactly, without modification.
Should users require higher resolution graphics, send mail to tsu@ipcc-wg2.gov, referencing the figure number in question in the subject line, and a member of the WGII Technical Support Unit will respond to your request. High-resolution encapsulated postscript will be provided - with the stipulation that it be replicated exactly as published (© IPCC 2012), that the reproduced graphic include the complete caption found in the SREX volume, and that the source be identified via the following citation:
IPCC, 2012: Summary for Policymakers. In: Managing the Risks of Extreme Events and Disasters to Advance Climate Change Adaptation [Field, C.B., V. Barros, T.F. Stocker, D. Qin, D.J. Dokken, K.L. Ebi, M.D. Mastrandrea, K.J. Mach, G.-K. Plattner, S.K. Allen, M. Tignor, and P.M. Midgley (eds.)]. A Special Report of Working Groups I and II of the Intergovernmental Panel on Climate Change. Cambridge University Press, Cambridge, UK, and New York, NY, USA, pp. 3-21.
- Figure SPM.1: Illustration of the core concepts of SREX. The report assesses how exposure and vulnerability to weather and climate events determine impacts and the likelihood of disasters (disaster risk). It evaluates the influence of natural climate variability and anthropogenic climate change on climate extremes and other weather and climate events that can contribute to disasters, as well as the exposure and vulnerability of human society and natural ecosystems. It also considers the role of development in trends in exposure and vulnerability, implications for disaster risk, and interactions between disasters and development. The report examines how disaster risk management and adaptation to climate change can reduce exposure and vulnerability to weather and climate events and thus reduce disaster risk, as well as increase resilience to the risks that cannot be eliminated. Other important processes are largely outside the scope of this report, including the influence of development on greenhouse gas emissions and anthropogenic climate change, and the potential for mitigation of anthropogenic climate change. [1.1.2, Figure 1-1].

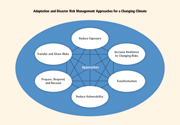
- Figure SPM.2: Adaptation and disaster risk management approaches for reducing and managing disaster risk in a changing climate. This report assesses a wide range of complementary adaptation and disaster risk management approaches that can reduce the risks of climate extremes and disasters and increase resilience to remaining risks as they change over time. These approaches can be overlapping and can be pursued simultaneously. [6.5, Figure 6-3, 8.6].
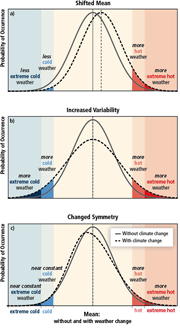
- Figure SPM.3: The effect of changes in temperature distribution on extremes. Different changes in temperature distributions between present and future climate and their effects on extreme values of the distributions: (a) effects of a simple shift of the entire distribution toward a warmer climate; (b) effects of an increase in temperature variability with no shift in the mean; (c) effects of an altered shape of the distribution, in this example a change in asymmetry toward the hotter part of the distribution. [Figure 1-2, 1.2.2].
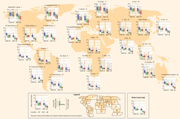
- Figure SPM.4A: Projected return periods for the maximum daily temperature that was exceeded on average once during a 20-year period in the late 20th century (1981–2000). A decrease in return period implies more frequent extreme temperature events (i.e., less time between events on average). The box plots show results for regionally averaged projections for two time horizons, 2046 to 2065 and 2081 to 2100, as compared to the late 20th century, and for three different SRES emissions scenarios (B1, A1B, A2) (see legend). Results are based on 12 global climate models (GCMs) contributing to the third phase of the Coupled Model Intercomparison Project (CMIP3). The level of agreement among the models is indicated by the size of the colored boxes (in which 50% of the model projections are contained), and the length of the whiskers (indicating the maximum and minimum projections from all models). See legend for defined extent of regions. Values are computed for land points only. The ‘Globe’ inset box displays the values computed using all land grid points. [3.3.1, Figure 3-1, Figure 3-5].
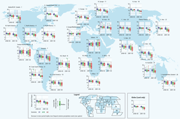
- Figure SPM.4B: Projected return periods for a daily precipitation event that was exceeded in the late 20th century on average once during a 20-year period (1981–2000). A decrease in return period implies more frequent extreme precipitation events (i.e., less time between events on average). The box plots show results for regionally averaged projections for two time horizons, 2046 to 2065 and 2081 to 2100, as compared to the late 20th century, and for three different SRES emissions scenarios (B1, A1B, A2) (see legend). Results are based on 14 GCMs contributing to the CMIP3. The level of agreement among the models is indicated by the size of the colored boxes (in which 50% of the model projections are contained), and the length of the whiskers (indicating the maximum and minimum projections from all models). See legend for defined extent of regions. Values are computed for land points only. The ‘Globe’ inset box displays the values computed using all land grid points. [3.3.2, Figure 3-1, Figure 3-7].
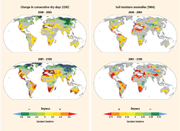
- Figure SPM.5: Projected annual changes in dryness assessed from two indices. Left column: Change in annual maximum number of consecutive dry days (CDD: days with precipitation <1 mm). Right column: Changes in soil moisture (soil moisture anomalies, SMA). Increased dryness is indicated with yellow to red colors; decreased dryness with green to blue. Projected changes are expressed in units of standard deviation of the interannual variability in the three 20-year periods 1980–1999, 2046–2065, and 2081–2100. The figures show changes for two time horizons, 2046–2065 and 2081–2100, as compared to late 20th-century values (1980–1999), based on GCM simulations under emissions scenario SRES A2 relative to corresponding simulations for the late 20th century. Results are based on 17 (CDD) and 15 (SMA) GCMs contributing to the CMIP3. Colored shading is applied for areas where at least 66% (12 out of 17 for CDD, 10 out of 15 for SMA) of the models agree on the sign of the change; stippling is added for regions where at least 90% (16 out of 17 for CDD, 14 out of 15 for SMA) of all models agree on the sign of the change. Grey shading indicates where there is insufficient model agreement (<66%). [3.5.1, Figure 3-9].
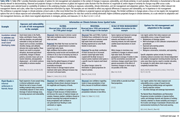
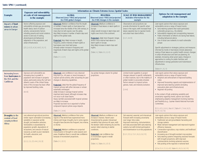
- Table SPM 1: Illustrative examples of options for risk management and adaptation in the context of changes in exposure, vulnerability, and climate extremes. In each example, information is characterized at the scale directly relevant to decisionmaking. Observed and projected changes in climate extremes at global and regional scales illustrate that the direction of, magnitude of, and/or degree of certainty for changes may differ across scales.
The examples were selected based on availability of evidence in the underlying chapters, including on exposure, vulnerability, climate information, and risk management and adaptation options. They are intended to reflect relevant risk management themes and scales, rather than to provide comprehensive information by region. The examples are not intended to reflect any regional differences in exposure and vulnerability, or in experience in risk management.
The confidence in projected changes in climate extremes at local scales is often more limited than the confidence in projected regional and global changes. This limited confidence in changes places a focus on low-regrets risk management options that aim to reduce exposure and vulnerability and to increase resilience and preparedness for risks that cannot be entirely eliminated. Higher-confidence projected changes in climate extremes, at a scale relevant to adaptation and risk management decisions, can inform more targeted adjustments in strategies, policies, and measures. [3.1.6, Box 3-2, 6.3.1, 6.5.2].
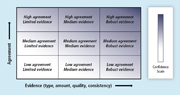
- Figure SPM BOX 2: A depiction of evidence and agreement statements and their relationship to confidence. Confidence increases toward the top-right corner as suggested by the increasing strength of shading. Generally, evidence is most robust when there are multiple, consistent independent lines of high-quality evidence.
Videos
|