Quick Links
|
Report by Chapters
SPM in UN languages
Drafts and Review Materials
Disclaimer:
As part of its commitment to openness and transparency, the IPCC releases drafts that have been submitted for formal expert and/or government review, review comments on
these drafts, and author responses to these comments after publication of the associated IPCC Report or Technical Paper. During the multi-stage review process,
expert reviewers and governments are invited to comment on the accuracy and completeness of the scientific/technical/socioeconomic content and the overall balance
of the drafts. Therefore, review comments and author responses should be considered within the context of the final report. Drafts, review comments, and author
responses are pre-decisional materials that are confidential until publication of the final Report or Technical Paper; they are not the results of the assessment
and may not be cited, quoted, or distributed as such1. Only the approved, adopted, and accepted Reports or Technical Papers may be cited or quoted as the results
of the assessment.
| Title |
Second Order Draft |
Final Draft |
| Draft |
Review |
Draft |
| Summary for Policymakers |
PDF |
PDF |
PDF |
| Technical Summary |
PDF |
PDF |
* |
* Note: The final draft of the Technical Summary and SRREN chapters are as they appear in the final SRREN. They can be found on the main report page of this site.
SPM Graphics
The Reproduction of SRREN figures by media or others is authorized free of charge and without formal written permission provided that the source is acknowledged as detailed below. Please be aware that figures cannot be altered in any way, including the full legend.
Figures should be cited as:
IPCC, 2011: Summary for Policymakers. In: IPCC Special Report on Renewable Energy Sources and Climate Change Mitigation
[O. Edenhofer, R. Pichs‐Madruga, Y. Sokona, K. Seyboth, P. Matschoss, S. Kadner, T. Zwickel, P. Eickemeier, G. Hansen, S. Schlömer, C. von Stechow (eds)], Cambridge University Press. Figure SPM.XX.
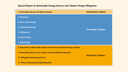
- Figure SPM.1: Structure of the SRREN. [Figure 1.1, 1.1.2].
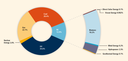
- Figure SPM.2: Shares of energy sources in total global primary energy supply in 2008 (492 EJ). Modern biomass contributes 38% of the total biomass share. [Figure 1.10, 1.1.5].
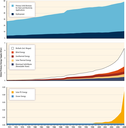
- Figure SPM.3: Historical development of global primary energy supply from renewable energy from 1971 to 2008. [Figure 1.12, 1.1.5].
- Figure SPM.4: Ranges of global technical potentials of RE sources derived from studies presented in Chapters 2 through 7. Biomass and solar are shown as primary energy due to their multiple uses; note that the fi gure is presented in logarithmic scale due to the wide range of assessed data. [Figure 1.1
7, 1.2.3].
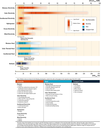
- Figure SPM.5: Range in recent levelized cost of energy for selected commercially available RE technologies in comparison to recent non-ren ewable energy costs. Technology sub-categories and discount rates were aggregated for this fi gure. For related fi gures with less or no such aggregation, see [1.3.2
, 10.5, Annex III].
- Figure SPM.6: Selected experience curves in logarithmic scale for (a) the price of silicon PV modules and onshore wind power plants per un it of capacity; and (b) the cost of sugarcane-based ethanol production [data from Figure 3.17, 3.8.3, Figure 7.20, 7.8.2, Figure 2.21, 2.7.2].
 
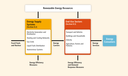
- Figure SPM.7: Pathways for RE integration to provide energy services, either into energy supply systems or on-site for use by the end-use sectors. [Figure 8.1, 8.1].
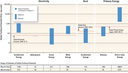
- Figure SPM.8: Estimates of lifecycle GHG emissions (g CO2 eq/kWh) for broad categories of electricity generation technologies, plus some technologies integrated with CCS. Land use-related net changes in carbon stocks (mainly applicable to biopower and hydropower from reservoirs) and land management impacts are excluded; negative estimates10 for biopower are based on assumptions about avoided emissions from residues and wastes in landfi ll disposals and co-products. References and methods for the review are reported in Annex II. The number of estimates is greater than the number of references because many studies considered multiple scenarios. Numbers report ed in parentheses pertain to additional references and estimates that evaluated technologies with CCS. Distributional information relates to estimates currently available in LCA
literature, not necessarily to underlying theoretical or practical extrema, or the true central tendency when considering all deployment conditions. [Figure 9.8, 9.3.4.1]
_____
10 Negative estimates’ within the terminology of lifecycle assessments presented in the SRREN refer to avoided emissions. Unlike the case of bioenergy combined with CCS, avoided emissions do not remove GHGs from the atmosphere.
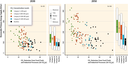
- Figure SPM.9: Global RE primary energy supply (direct equivalent) from 164 long-term scenarios versus fossil and industrial CO2 emissions in 2030 and 2050. Colour coding is based on categories of atmospheric CO2 concentration stabilization levels that are defi ned consistently with those in the AR4. The panels to the right of the scatter plots show the deployment levels of RE in each of the atmospheric CO2 concentration categories. The thick black line corresponds to the median, the coloured box corresponds to the inter-quartile range (25th to 75th percentile) and the ends of the white surrounding bars correspond to the total range across all reviewed scenarios. The grey crossed lines show the relationship in 2007. [Figure 10.2, 10.2.2.2].
- Figure SPM.10: Global RE primary energy supply (direct equivalent) by source in the group of Annex I (AI) and the group of Non-Annex I (NAI) countries in 164 long-term scenarios by 2030 and 2050. The thick black line corresponds to the median, the coloured box corresponds to the inter-quartile range (25th to 75th percentile) and the ends of the white surrounding bars correspond to the total range across all reviewed scenarios. [Figure 10.8, 10.2.2.5].
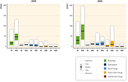
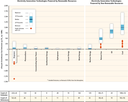
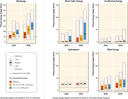
- Figure SPM.11: Global primary energy supply (direct equivalent) of bioenergy, wind, direct solar, hydro, and geothermal energy in 164 long-term scenarios in 2030 and 2050, and grouped by different categories of atmospheric CO2 concentration level that are defi ned consistently with those in the AR4. The thick black line corresponds to the median, the coloured box corresponds to the inter-quartile range (25th to 75th percentile) and the ends of the white surrounding bars correspond to the total range across all reviewed scenarios. [Excerpt from Figure 10.9, 10.2.2.5].
Videos
|